Accurate detection of intra-tumor heterogeneity toward improved patient stratification
Computational methods to detect subclonal heterogeneity from DNA-sequencing data, utilizing advances in mathematical modeling and parameter inference
Despite considerable efforts, recent evidence shows that currently available algorithms for estimating intratumor heterogeneity (ITH) remain limited. Detection of ITH and subclonal structure often exploits summary statistics of the DNA-sequencing data. Among the most common statistics is the Site Frequency Spectrum (SFS), which tallies the number of mutations at a given Variant Allele Frequency (VAF).
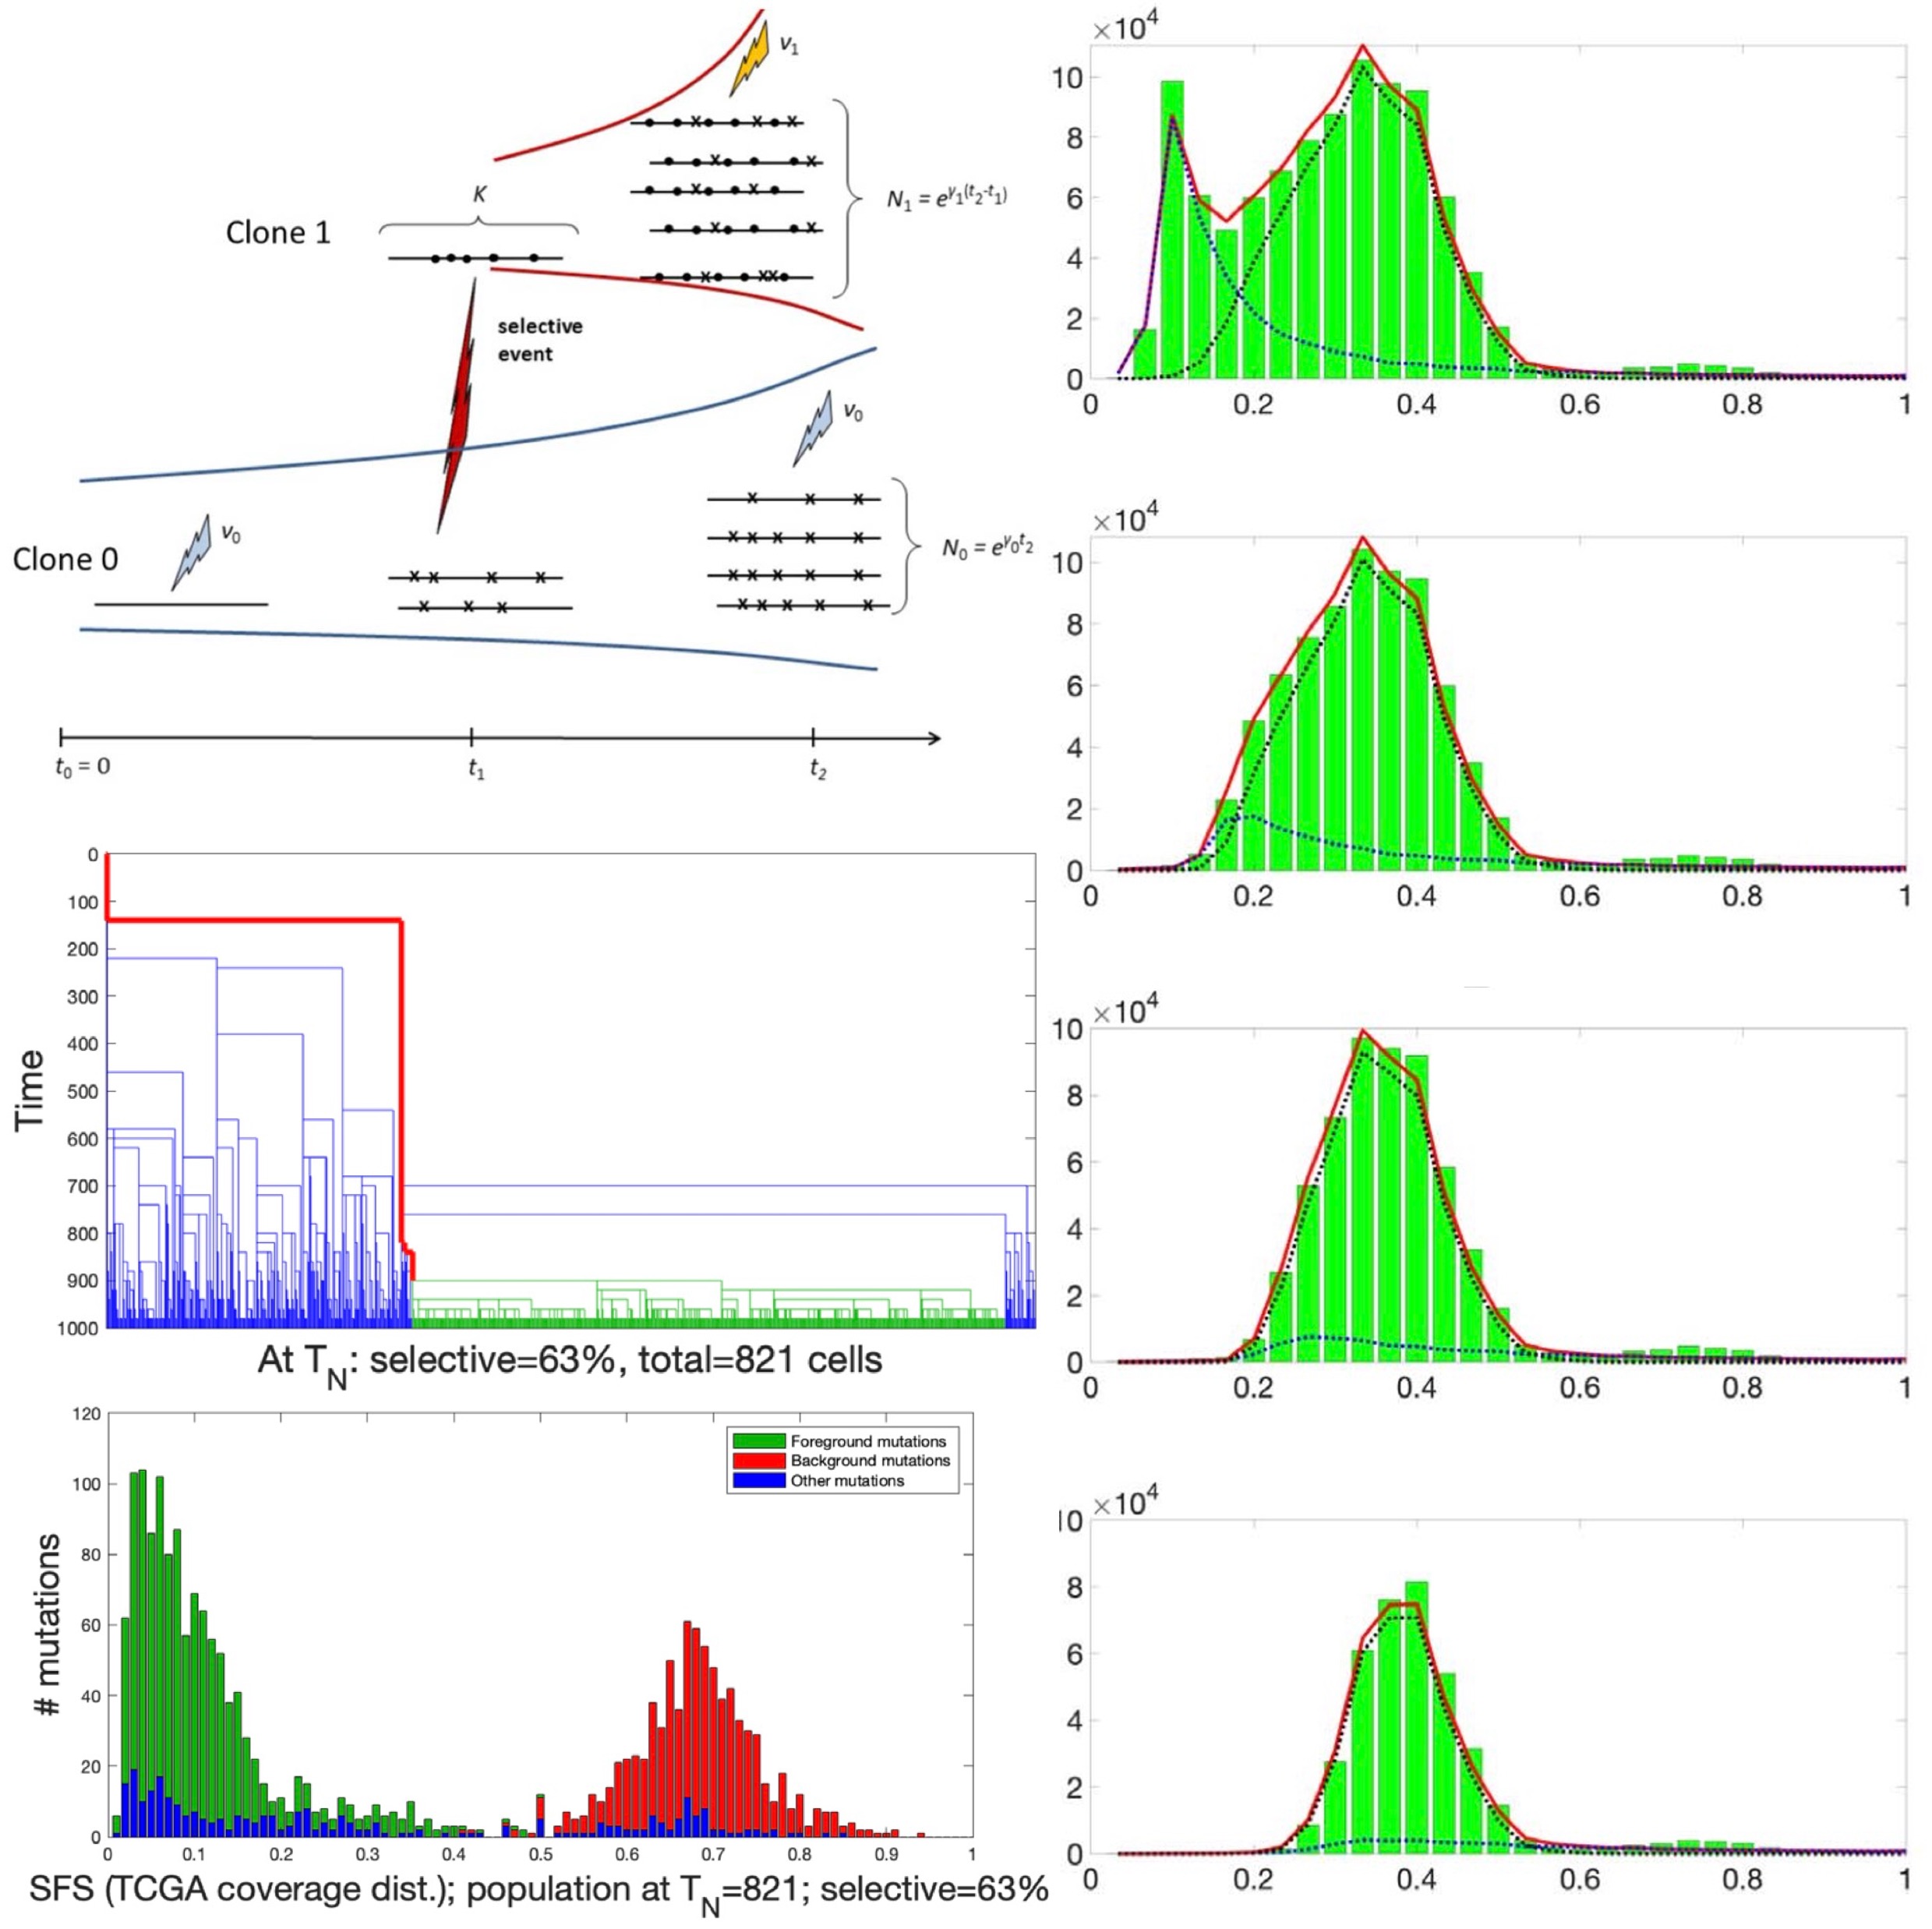
We examined the expected SFS under two different mathematical frameworks, the Moran model and the branching process (Dinh et al., 2020). The SFS may consist of one or more mutation clusters, reflecting the overall cancer cell population and any subclones undergoing positive selection. In addition, studies in population genetics had revealed that neutral mutations arising in all subclones further form a “tail” in the SFS, which most clustering algorithms do not incorporate. Not considering the tail risks overestimating the subclone count, and thus the cancer sample’s ITH.
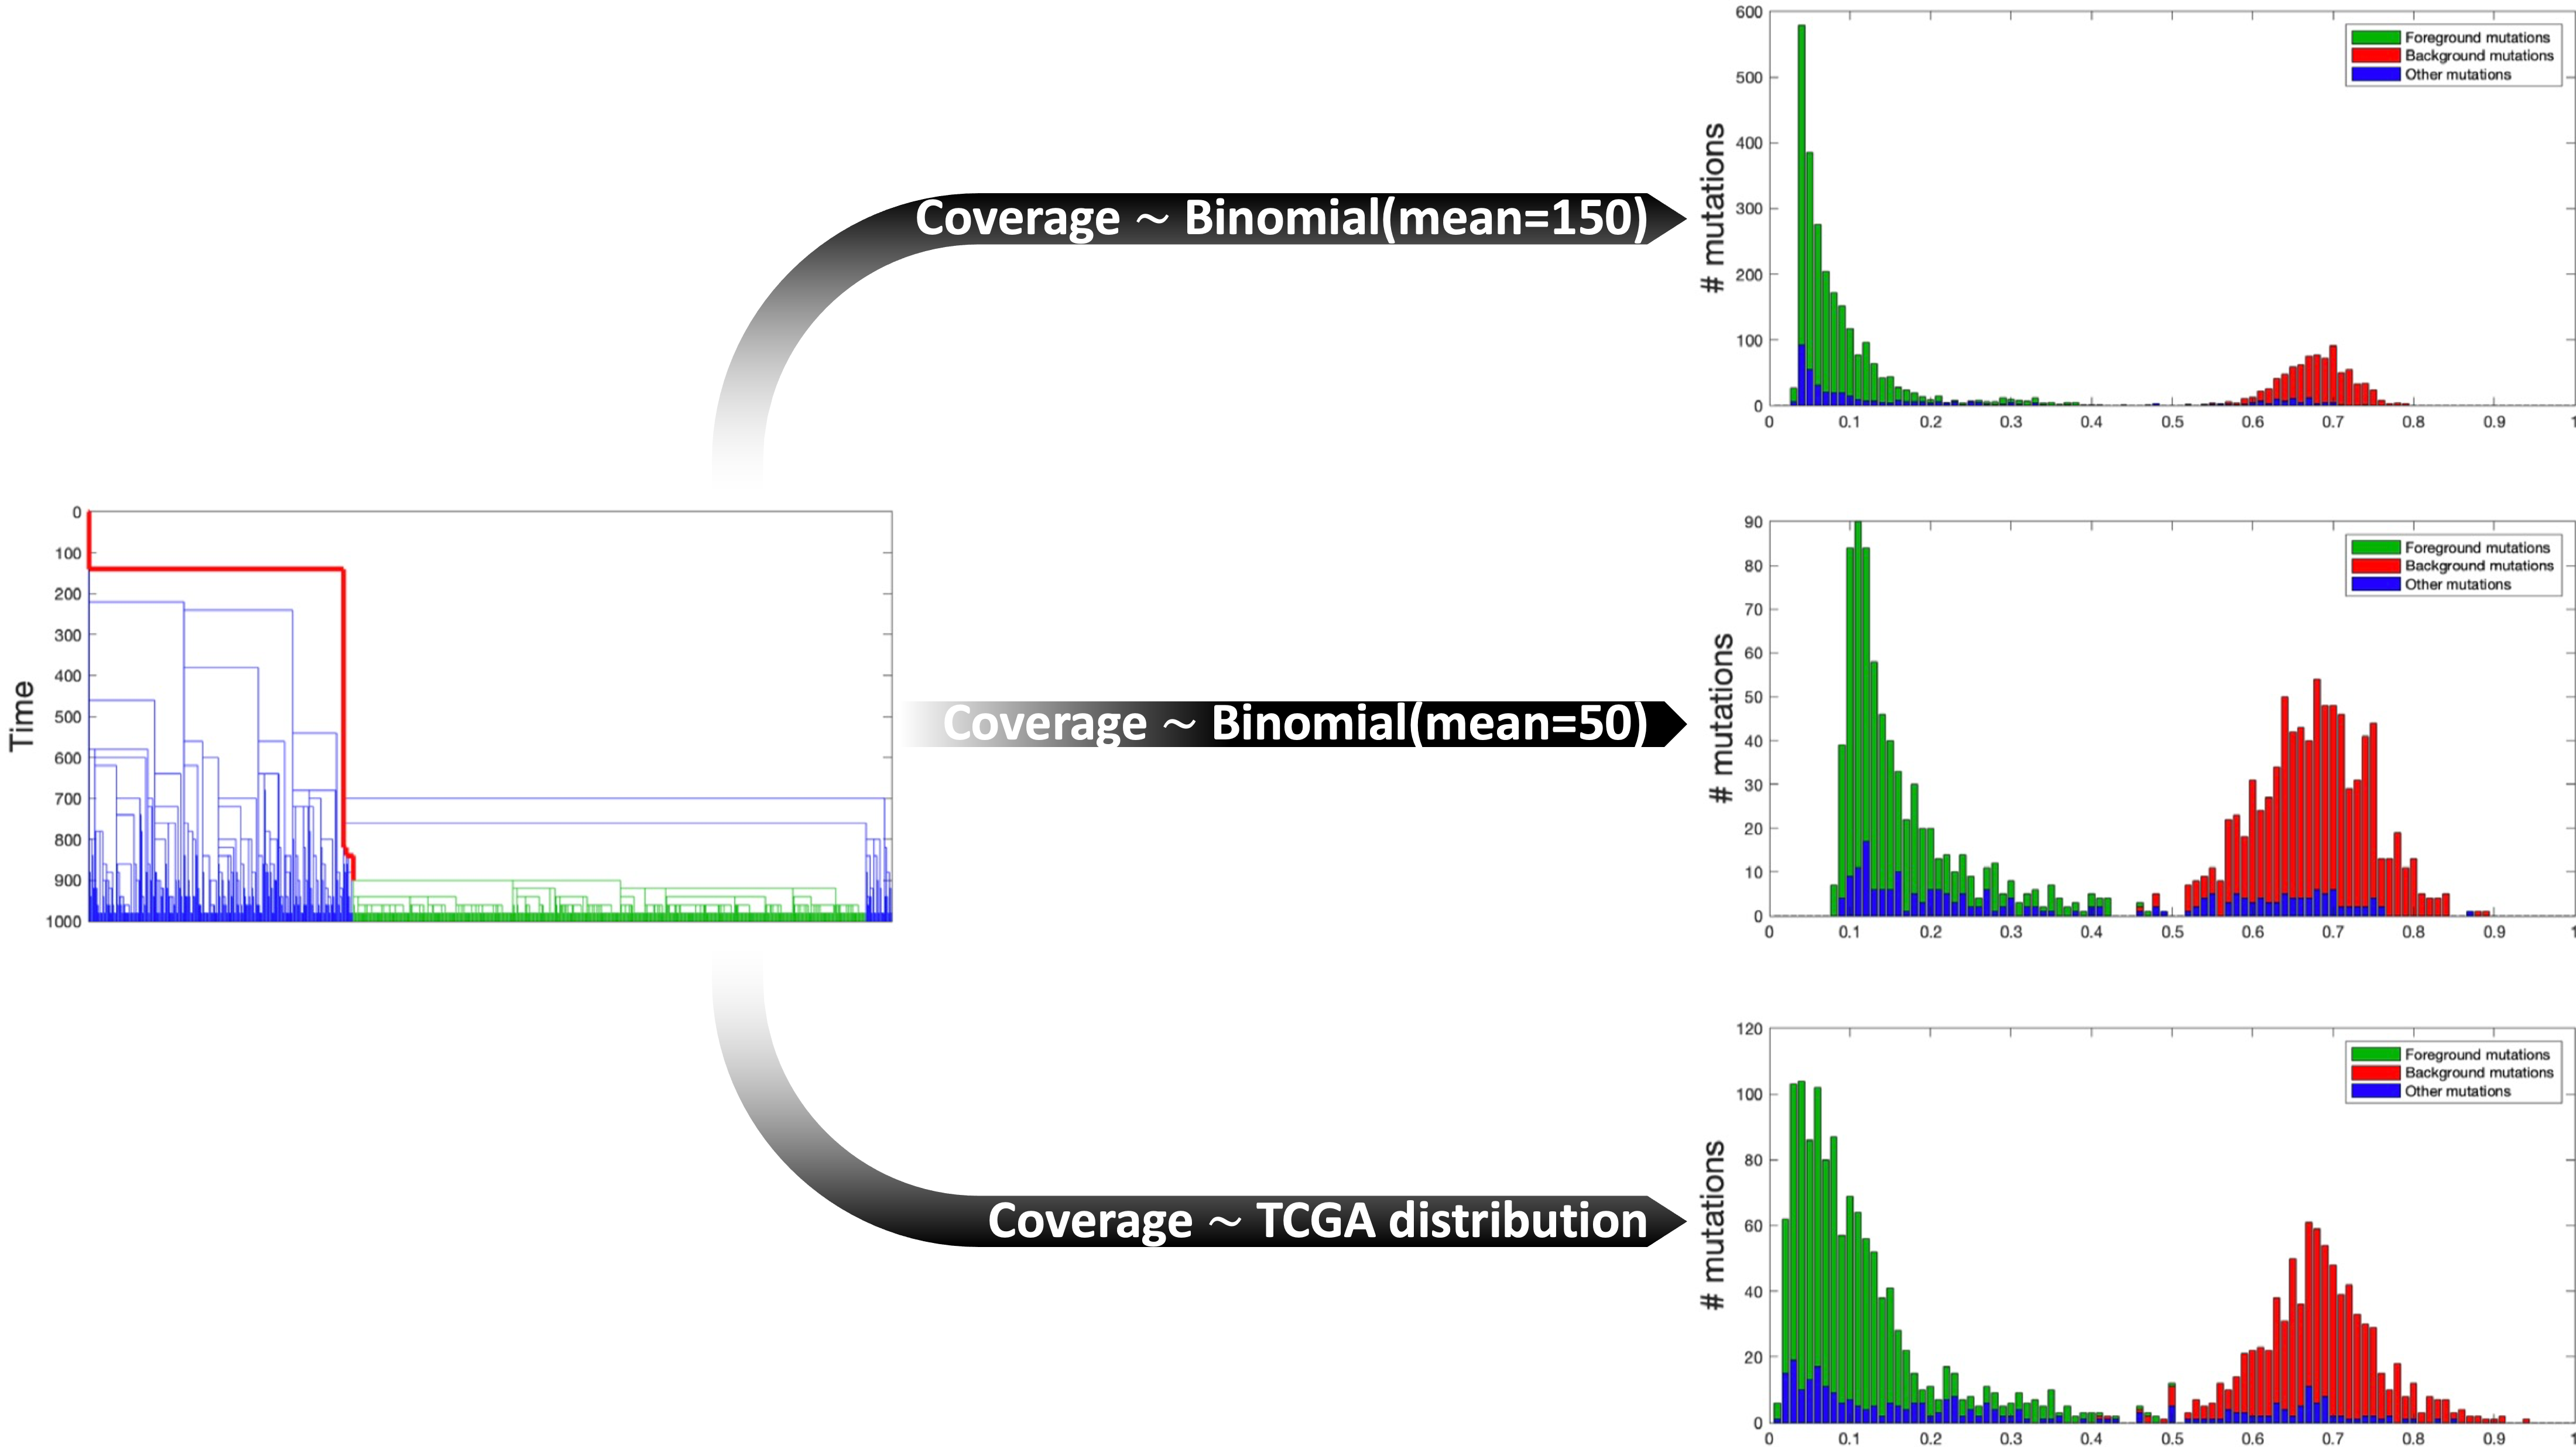
We found that because the SFS tail mainly consists of mutations at low VAFs, both its shape and mass are particularly sensitive to the DNA-sequencing coverage distribution and the data cleaning process as part of mutation calling. Therefore, better detection and characterization of the SFS tail requires the incorporation of both factors in the SFS formulation.
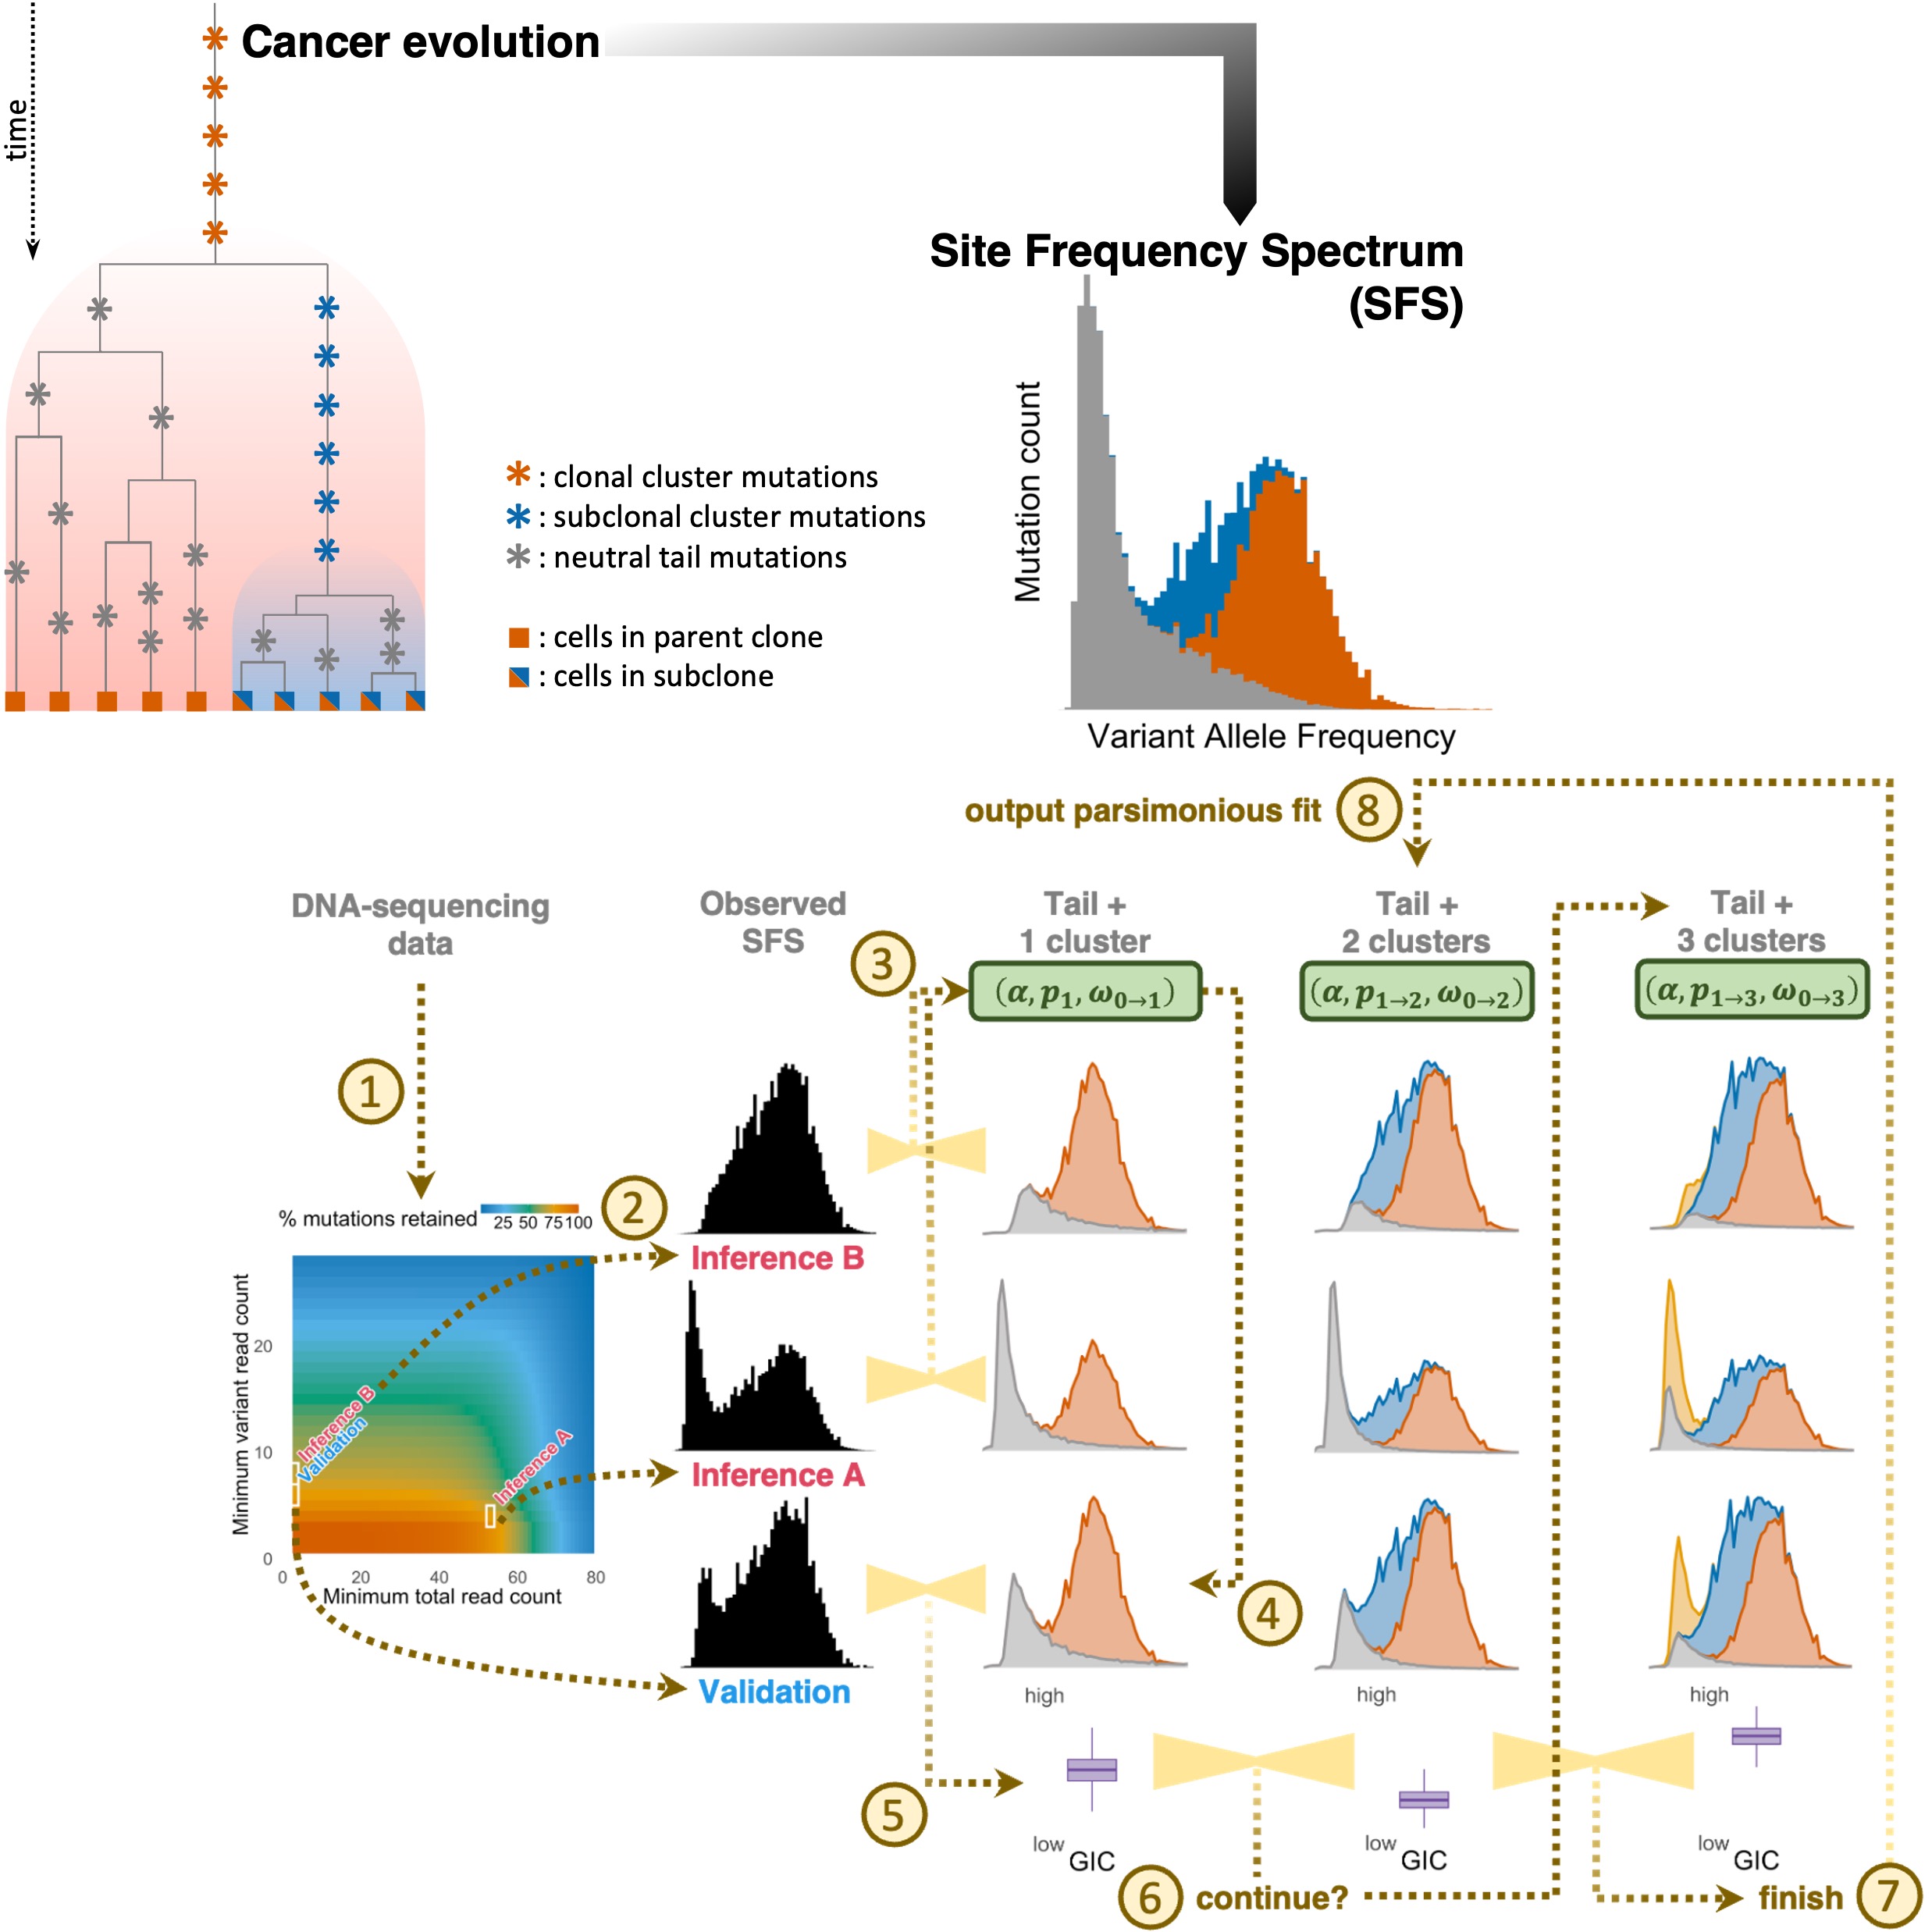
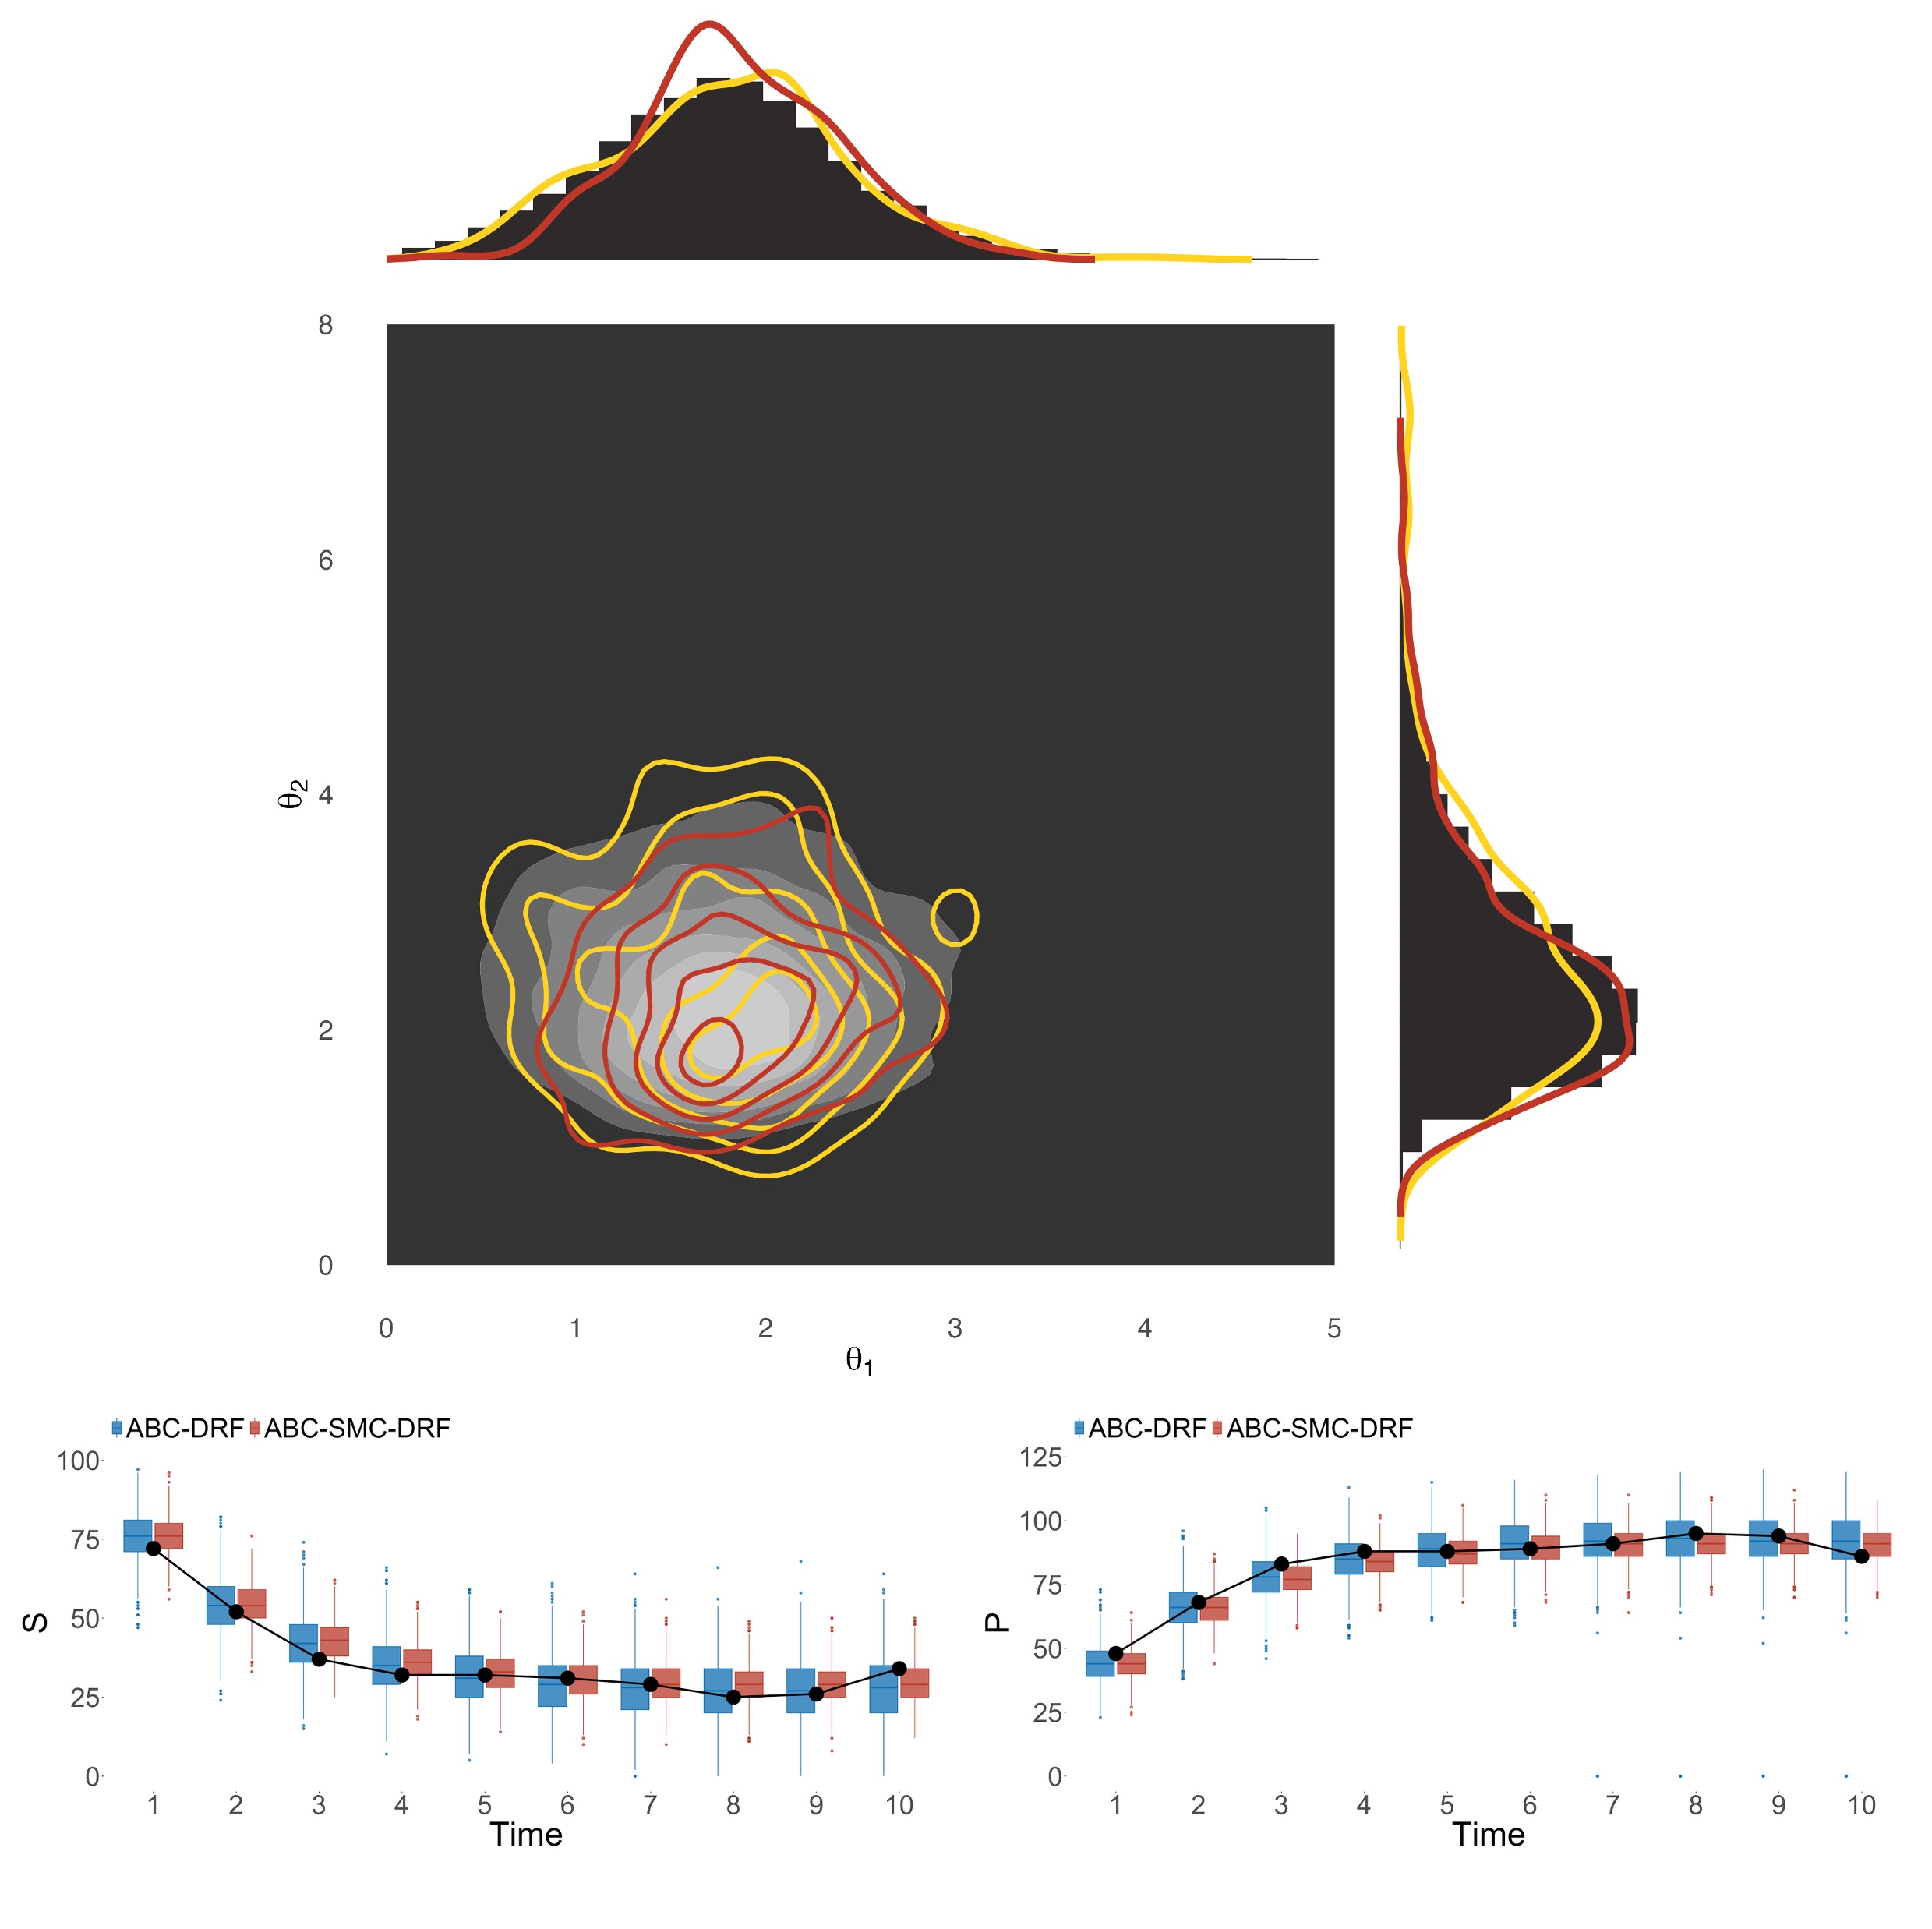
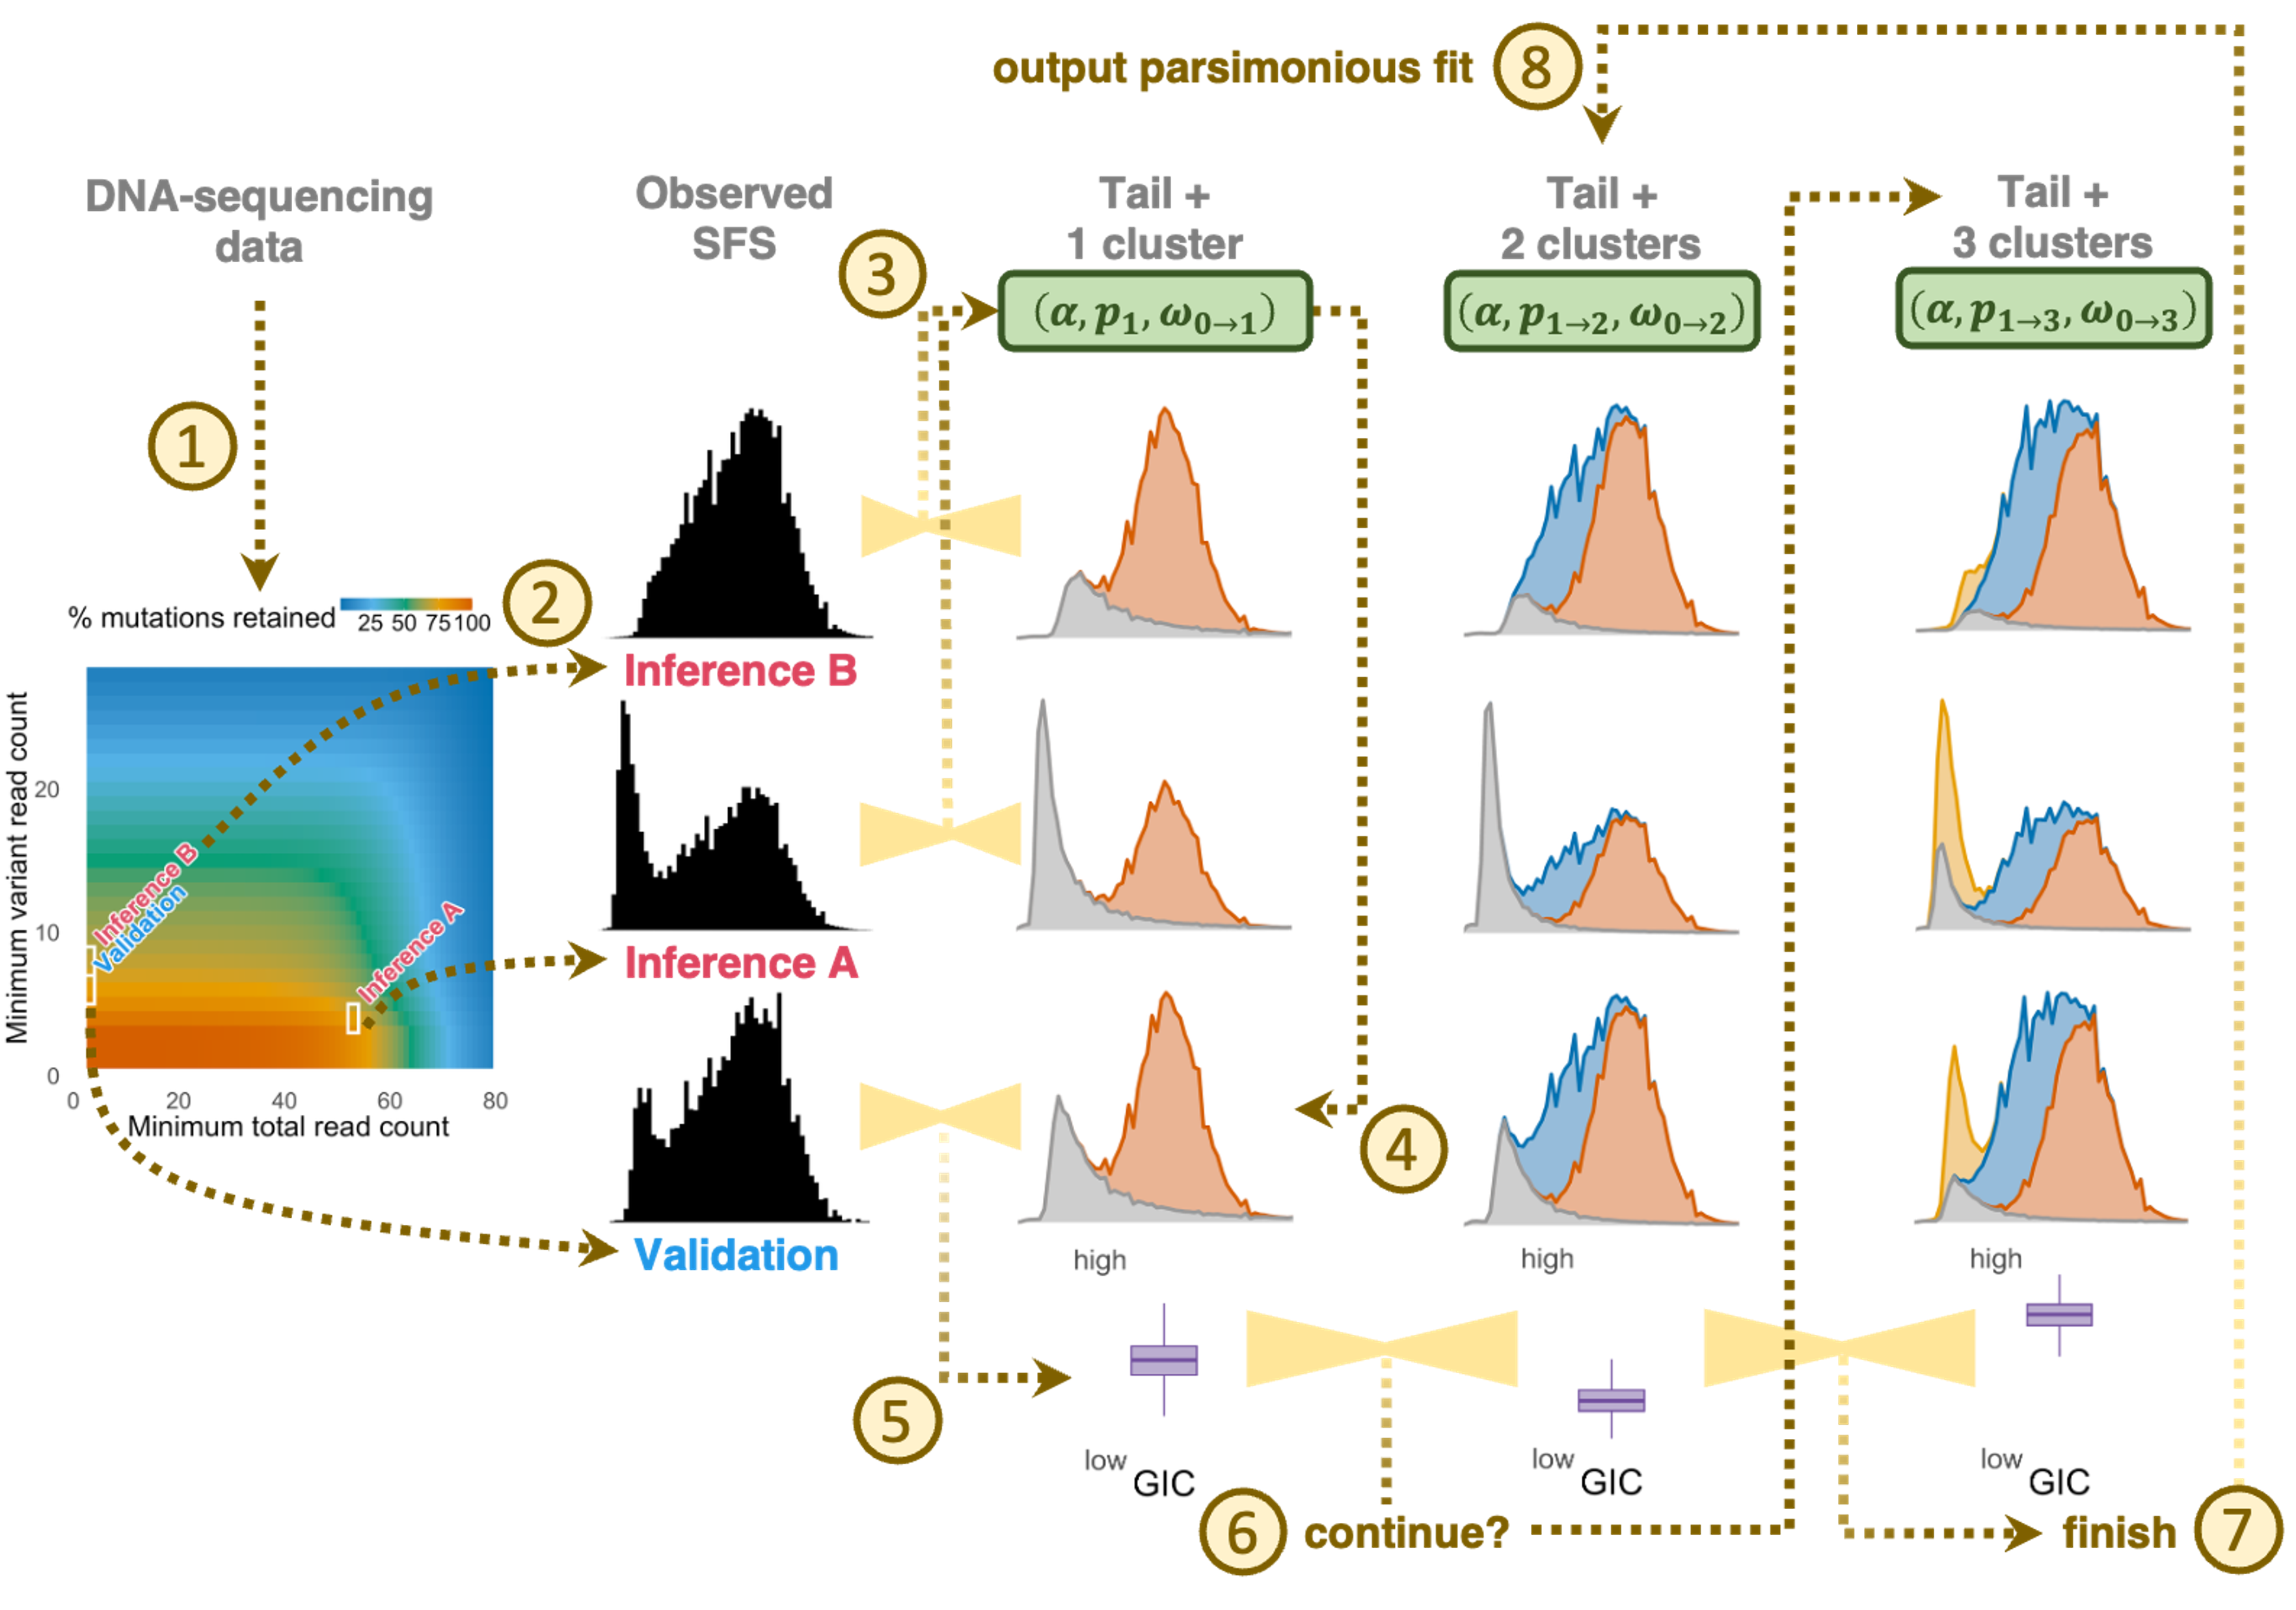
Based on this theoretical work, we developed DECODE (Deciphering Cancer Origin from DNA Evolution) (Chen et al., 2026), a novel mutation clustering method available as an R package on Github. Given a DNA-sequencing sample, it first finds 3 distinct filtering strategies based on total and variant read counts (step 1) and extracts the empirical SFS under each strategy (step 2). DECODE then infers the decomposition parameters under different clonality assumptions. For each cluster count, it implements ABC-SMC-RF (Dinh et al., 2025) to infer the tail power, each cluster’s mean VAF and each component’s mutation count, that best fit the first 2 filtered SFS (step 3). It then predicts the SFS under the 3rd filtering strategy, assuming the found parameters (step 4). The Generalized Information Criterion (GIC) then quantifies the goodness of the prediction, against the model’s complexity (step 5). DECODE selects models with higher ITH if the GIC decreases (step 6), otherwise it finishes (step 7) and reports the model with minimum GIC as the parsimonious decomposition of the data (step 8).
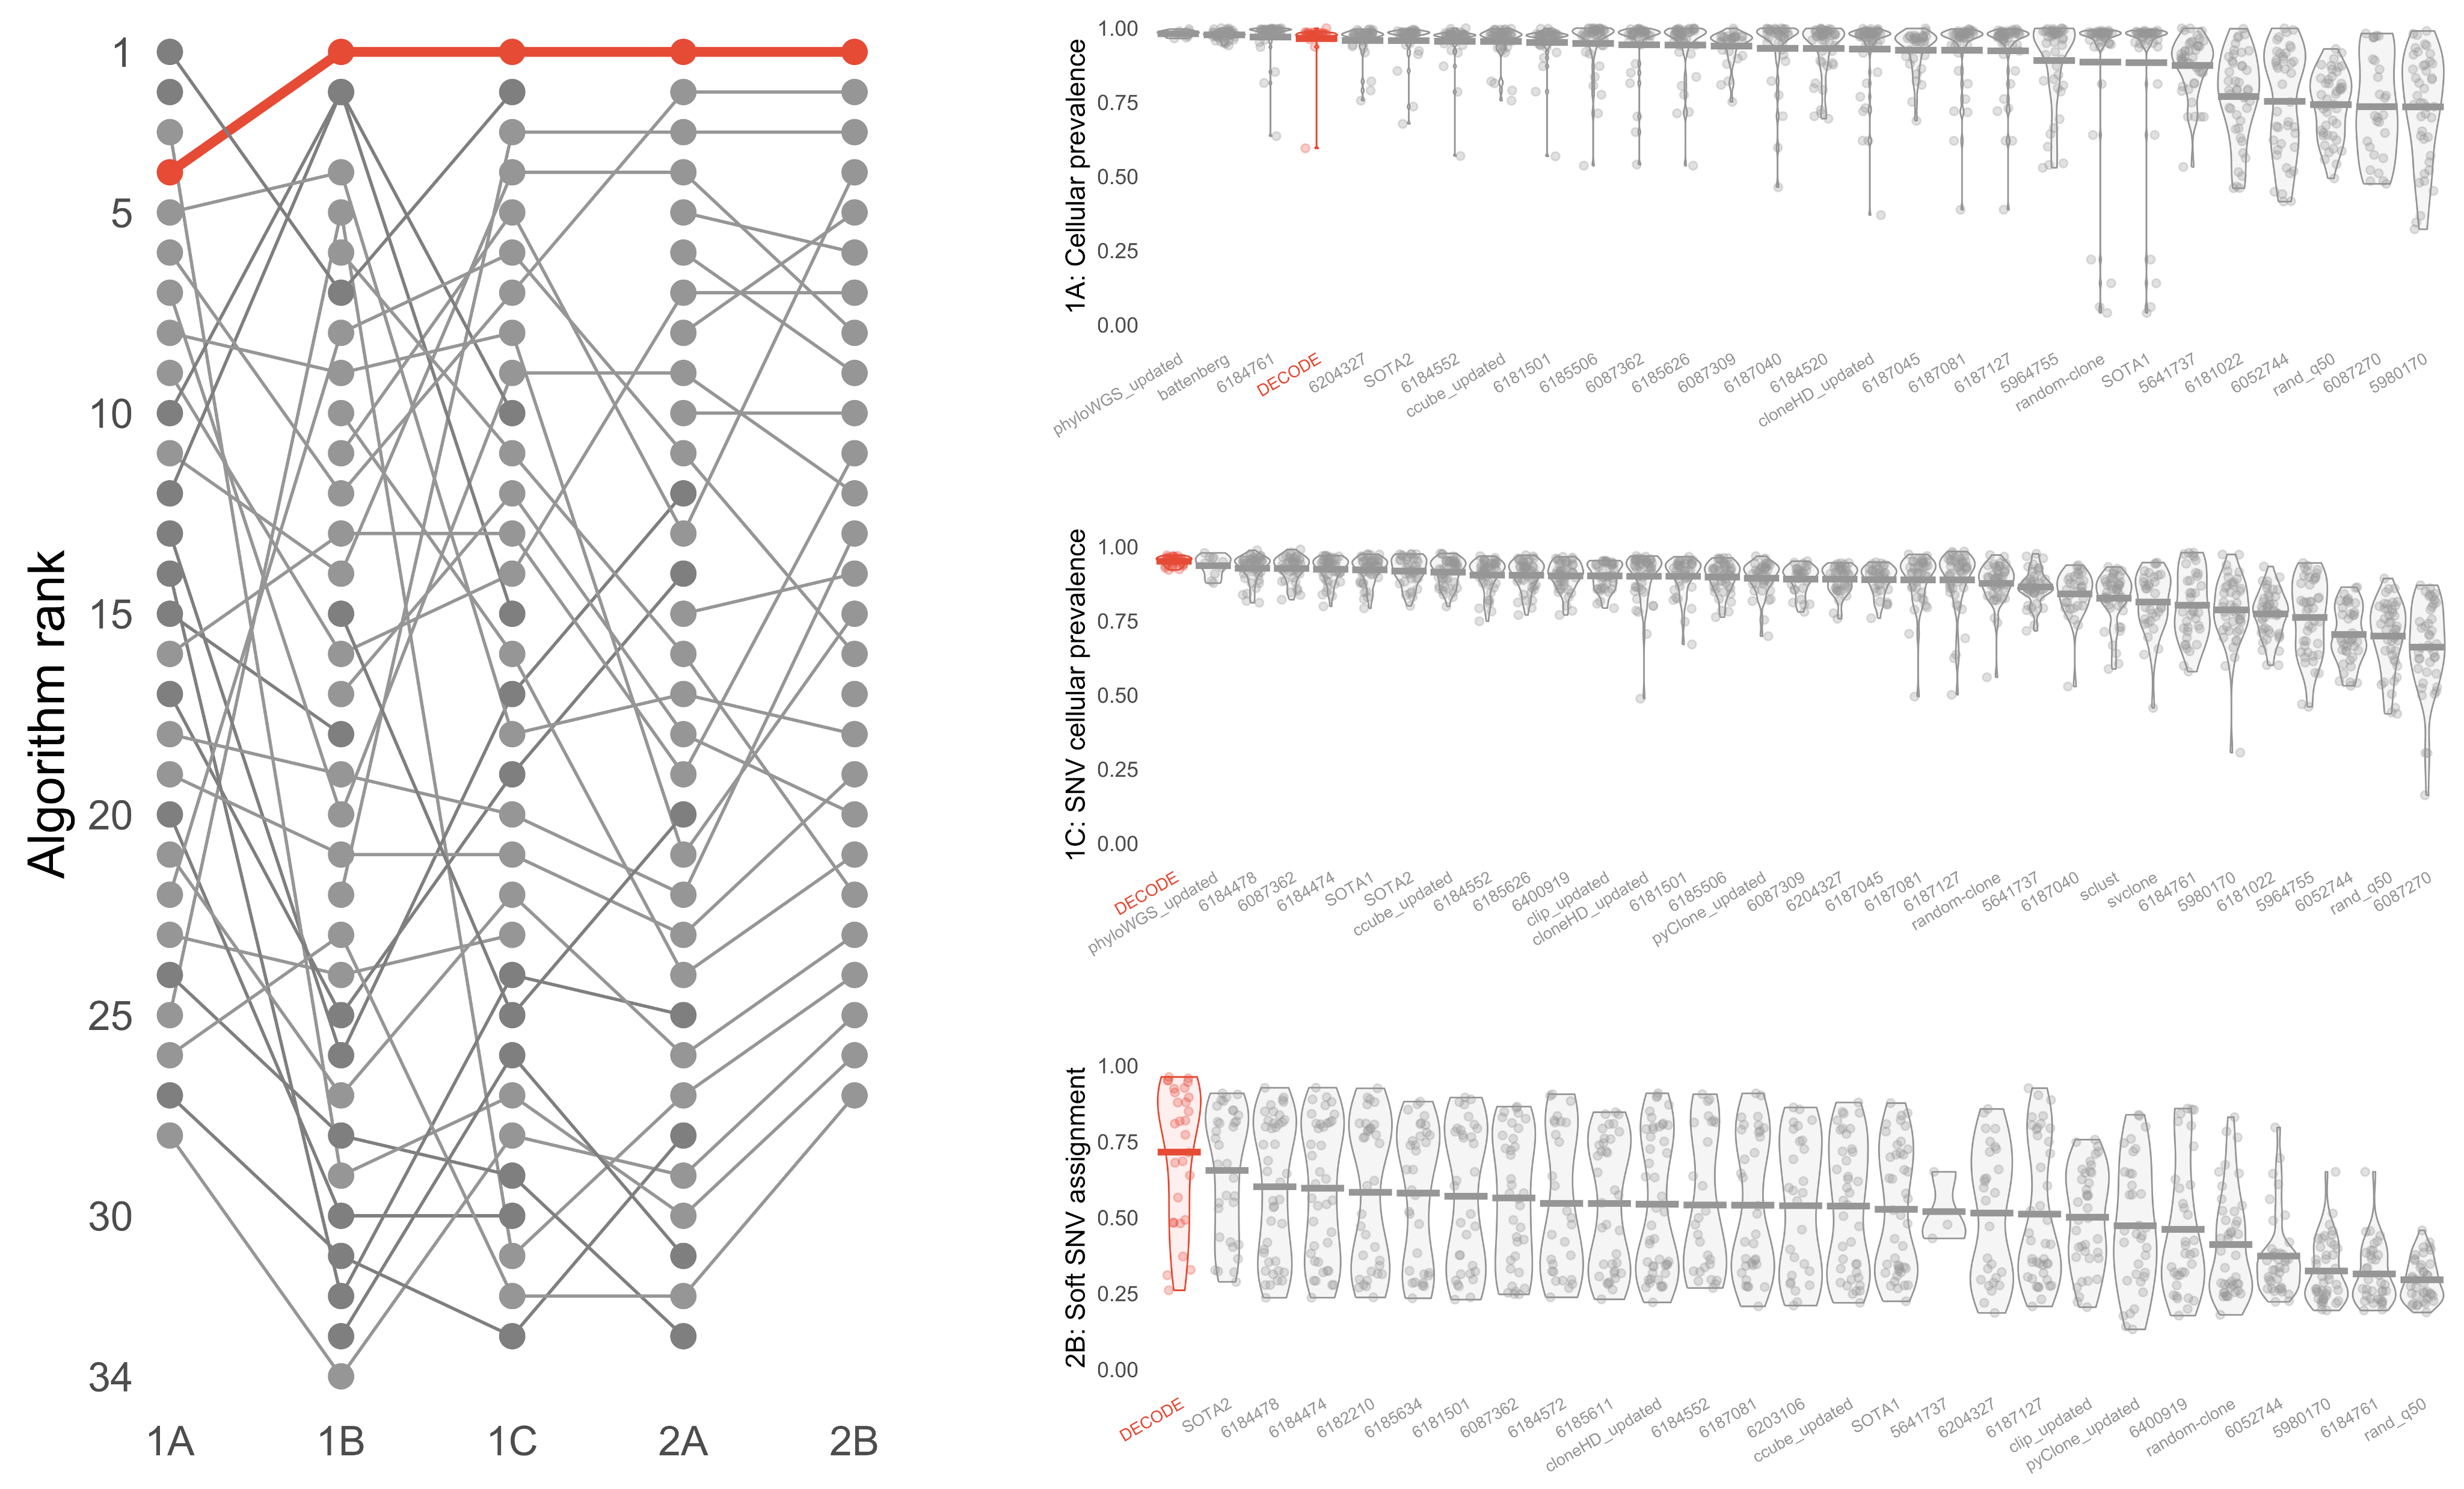
Implementing the ICGC-TCGA DREAM testing framework revealed that DECODE ranks among the top across inferring different aspects of clonal heterogeneity, including sample purity, subclone count, subclonal VAFs and mutation counts, and subclonal mutation assignments. Furthermore, compared to MOBSTER (currently the only other mutation clustering method that accounts for the SFS tail), DECODE identifies and characterizes the tail more accurately for samples with realistic sequencing depths.
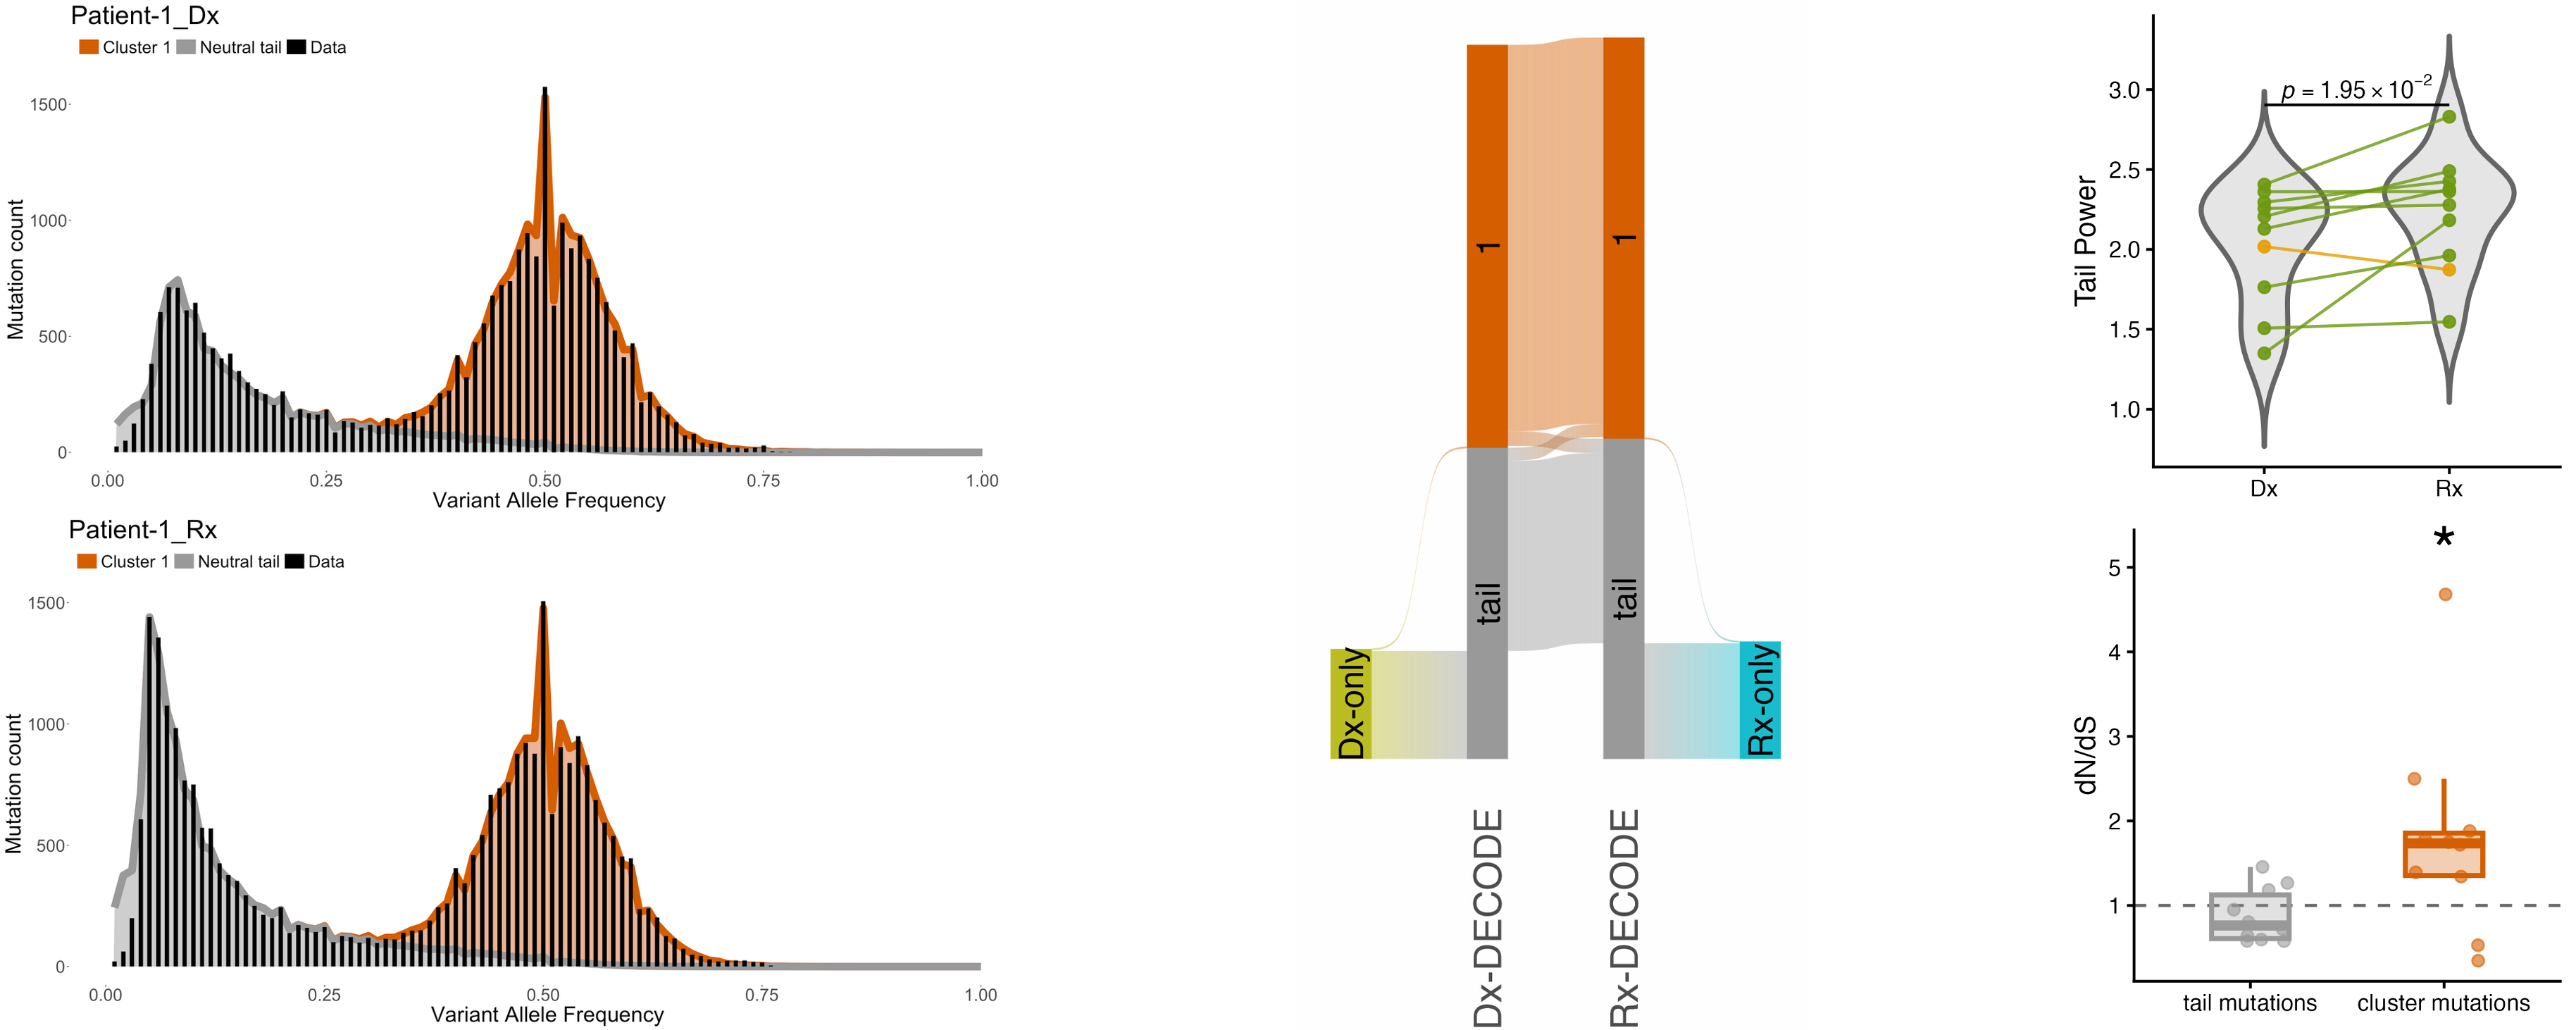
To demonstrate DECODE’s utility in inferring how cancer evolves, we analyzed paired diagnosis/relapse samples of Acute Myeloid Leukemia from Shlush et al. SciClone detects 4-7 subclones in each patient. However, its inferred mean VAFs of subclones present at both time points tend to be constant. The implied clonal equilibrium is biologically unrealistic, given that most patients achieved complete remission. MOBSTER detects the tail in only 1/20 samples, likely because the coverage depth is significantly lower than its sensitivity level.
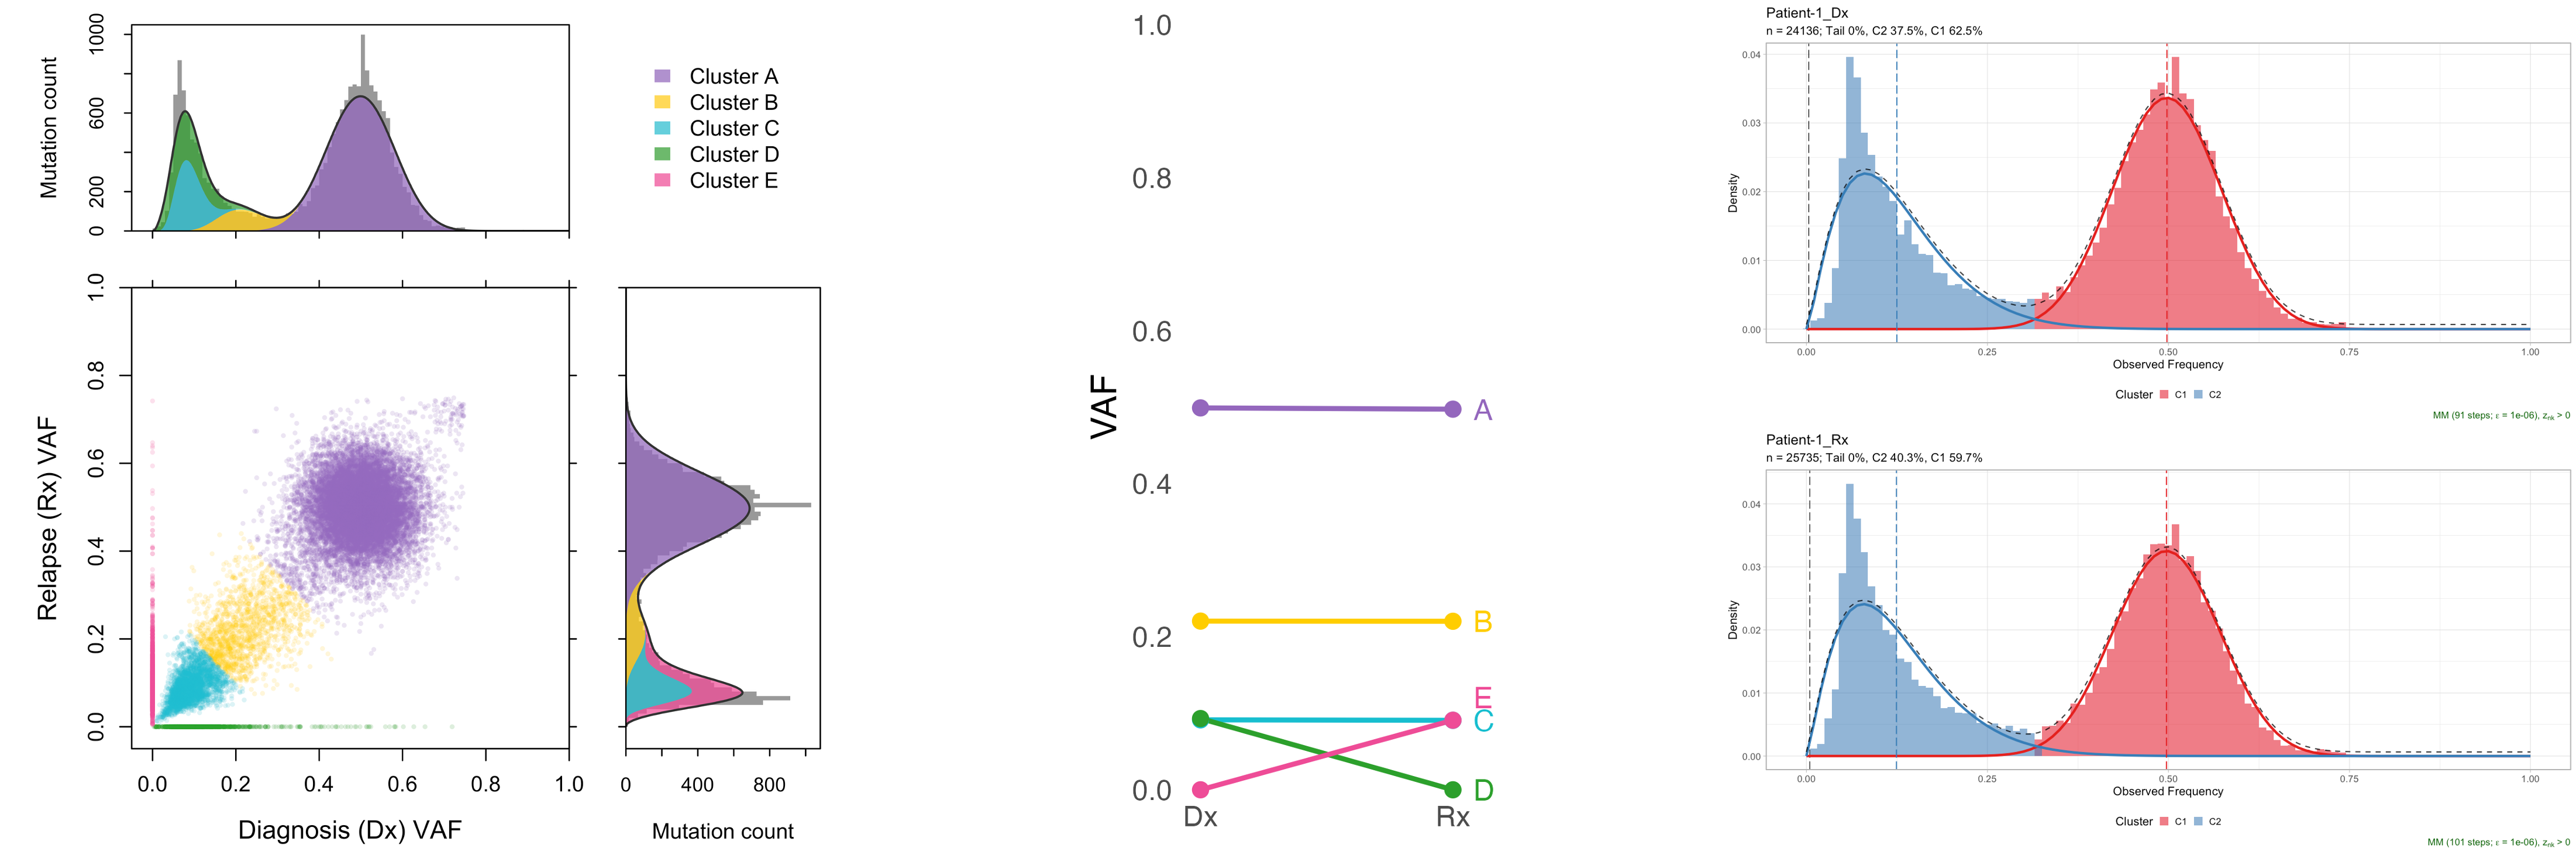
In contrast, DECODE detects the tail in all samples. Additionally, the mutation assignments are highly consistent in each patient. The results indicate that in most cases, AML relapse constitutes a continuation of the clonal evolution already present at diagnosis. DECODE-inferred tail power is lower at diagnosis compared to relapse in 9/10 patients, implying higher cancer aggression in the latter even without increased clonality. The dN/dS analysis further confirms that tail mutations are neutral and cluster mutations are positively selected.
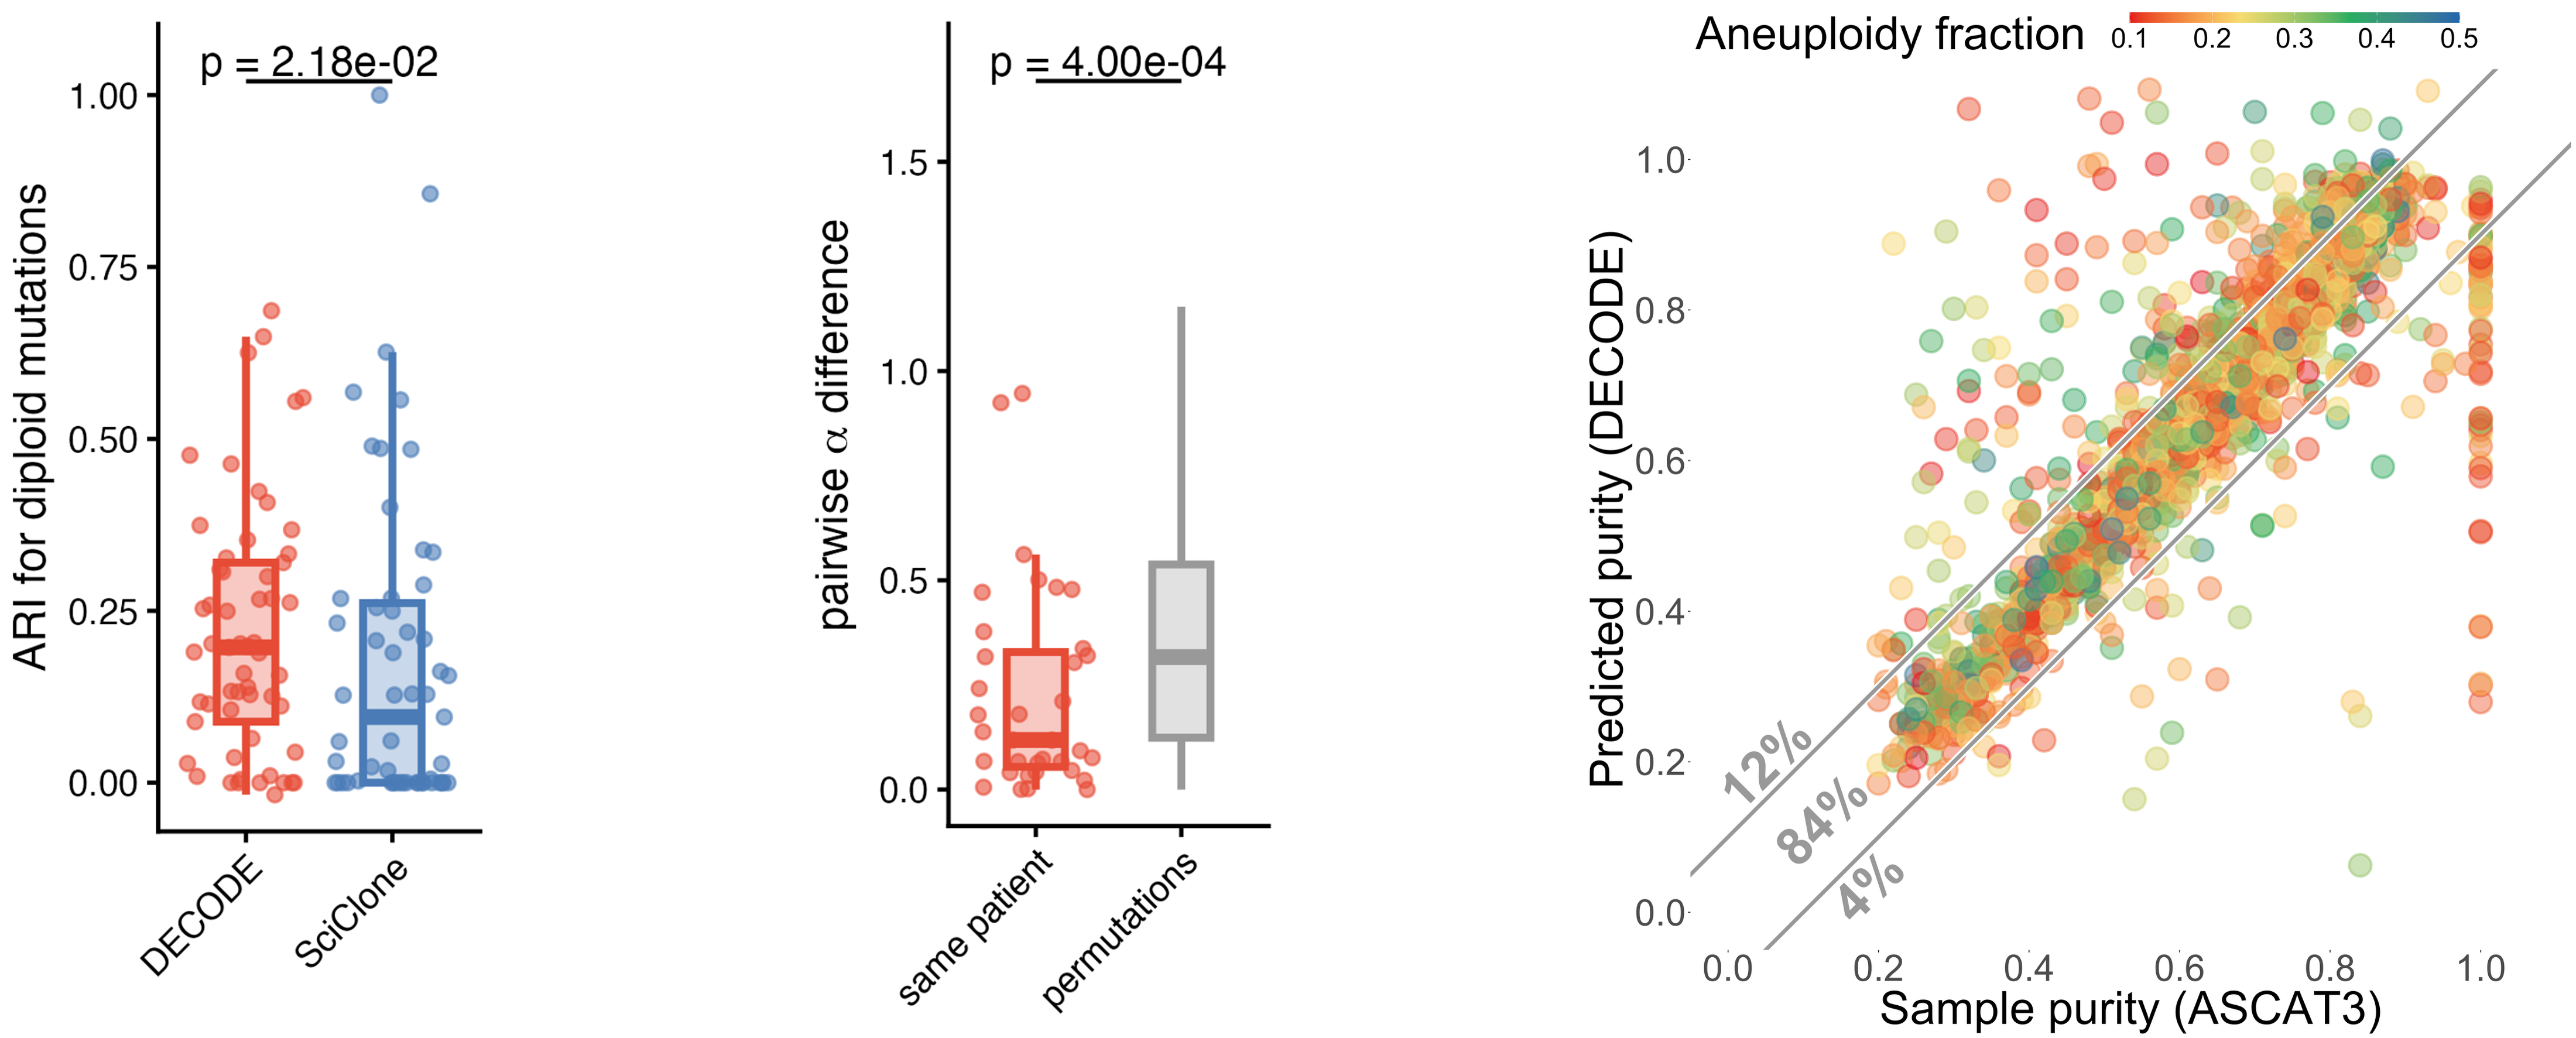
When applied to pan-cancer data from The Cancer Genome Atlas, DECODE’s mutation assignments are more consistent between same-patient biological replicates than SciClone. Its inferred tail powers for same-patient samples are also more in agreement than permuted pairs. Sample purities estimated based on DECODE’s truncal clusters agree with ASCAT3 in 84% of all samples. Together, these results indicate that DECODE’s results are consistent and robust.
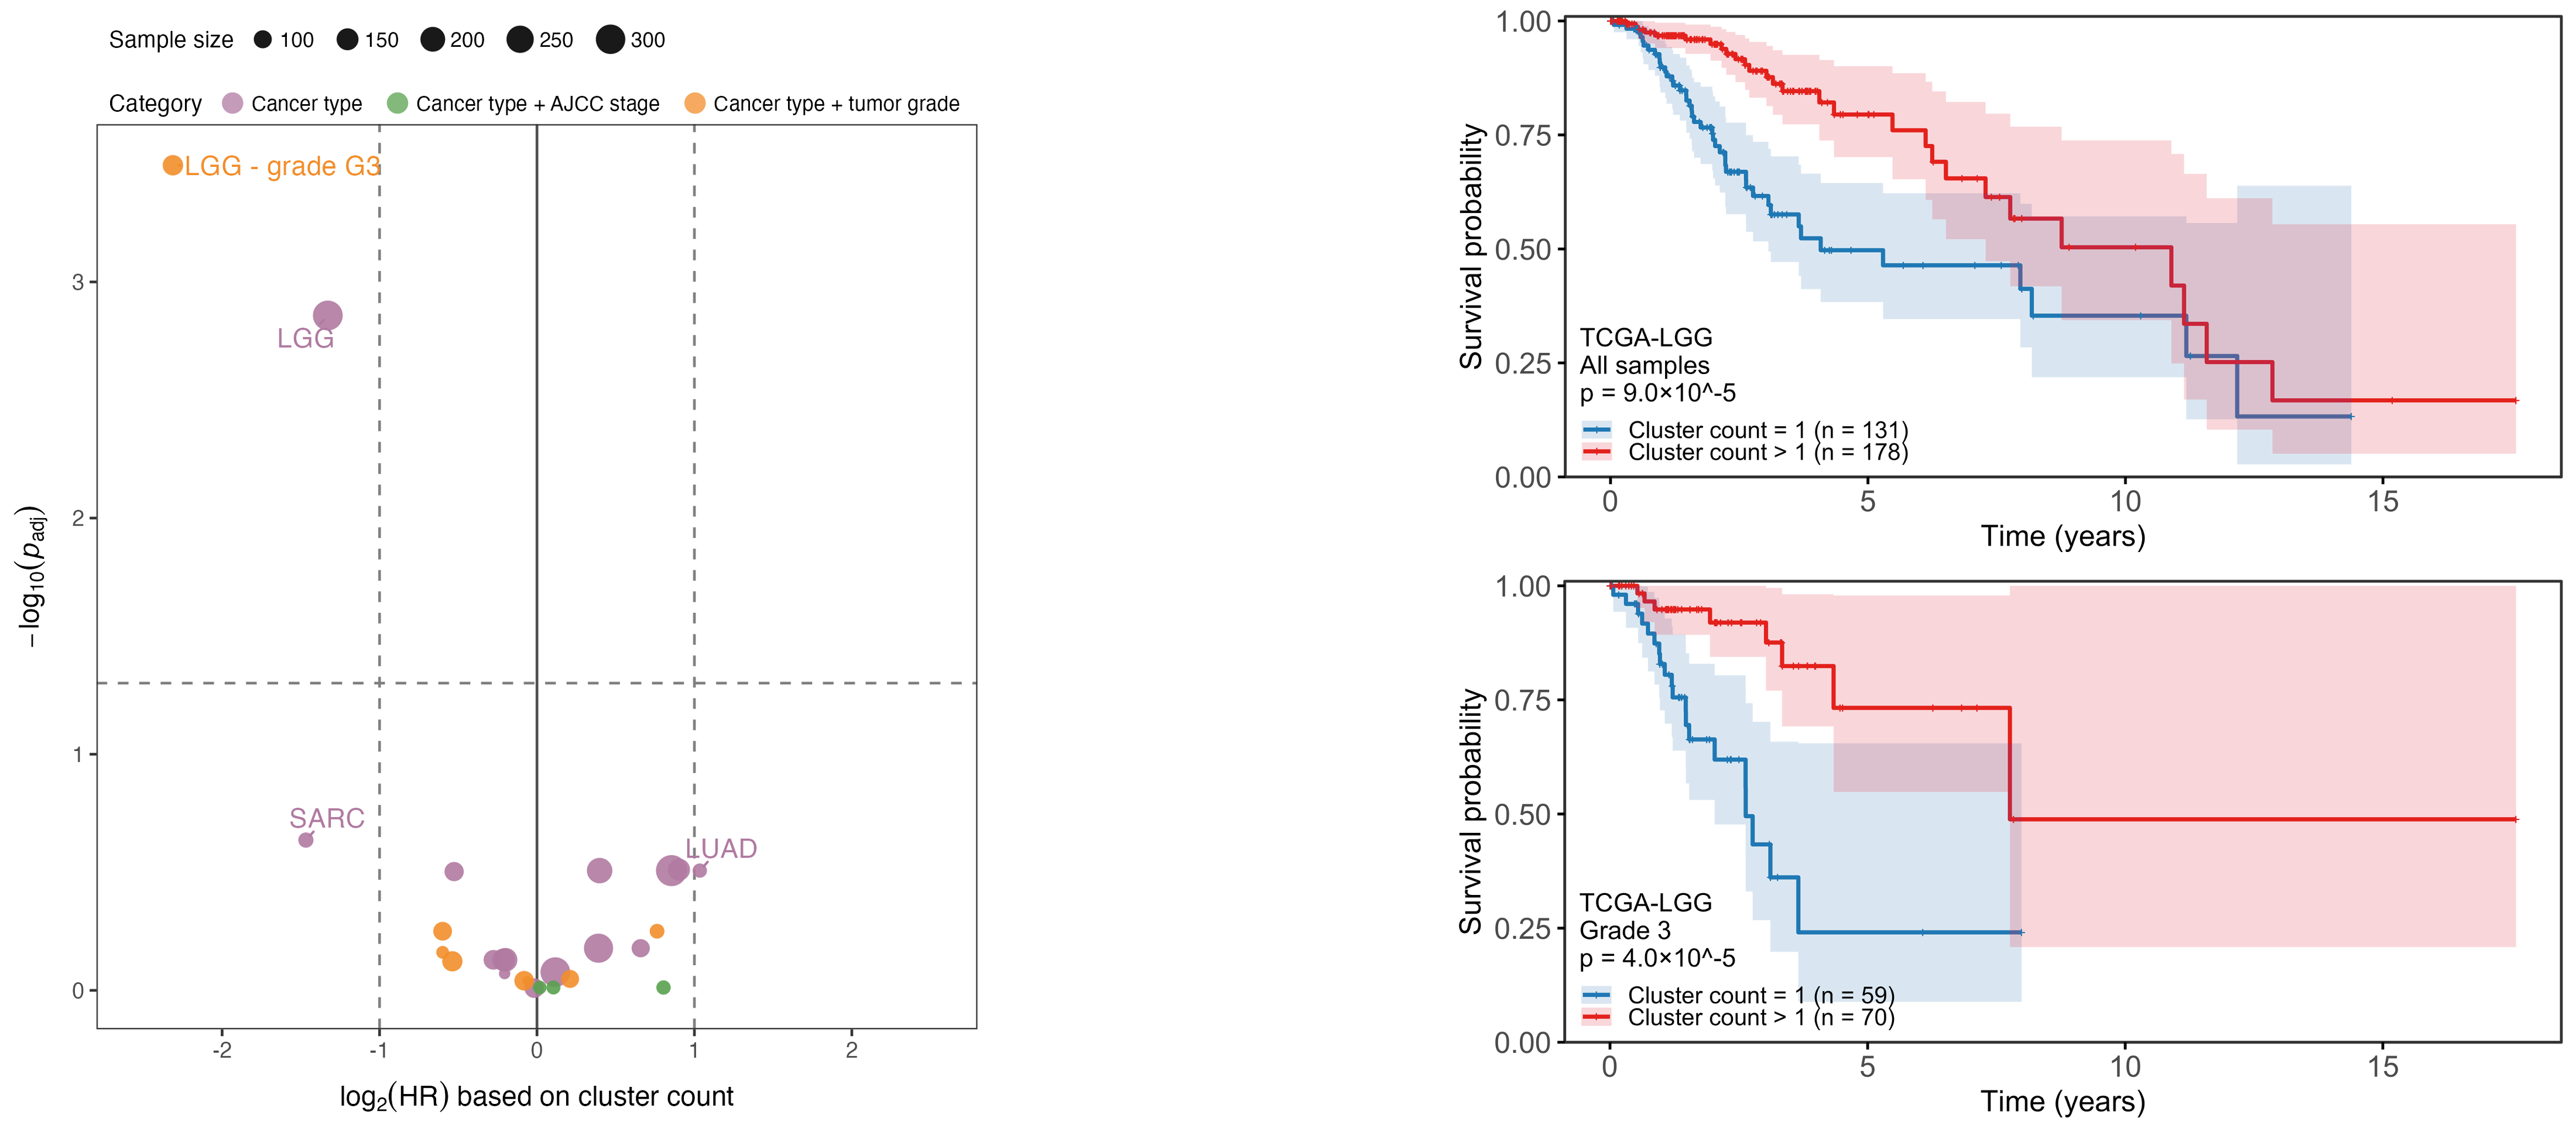
Subdividing each TCGA cohort into low- and high-clonality samples revealed a significant ITH-related hazard ratio in low-grade gliomas (LGG). The association is even stronger in LGG tumors of grade 3, indicating that DECODE-inferred clonality may provide prognostic information beyond what histology and staging capture in some cancer types.