Chromosomal instability and its impact on selection during cancer development
Mathematical and computational methods to extract the occurrence rates and selection coefficients of chromosomal instability from DNA-sequencing data
Cancer evolution has been studied extensively as a process of accumulating point mutations, which affect one or a few nucleotides at specific locations in the genome. However, some cancers have been known to be driven mostly by copy number aberrations (CNAs). These events can be inferred by examining the total and allele-specific copy numbers across the cancer genome. Chromosomal instability (CIN) is said to occur when a tumor exhibits a high number of CNAs.
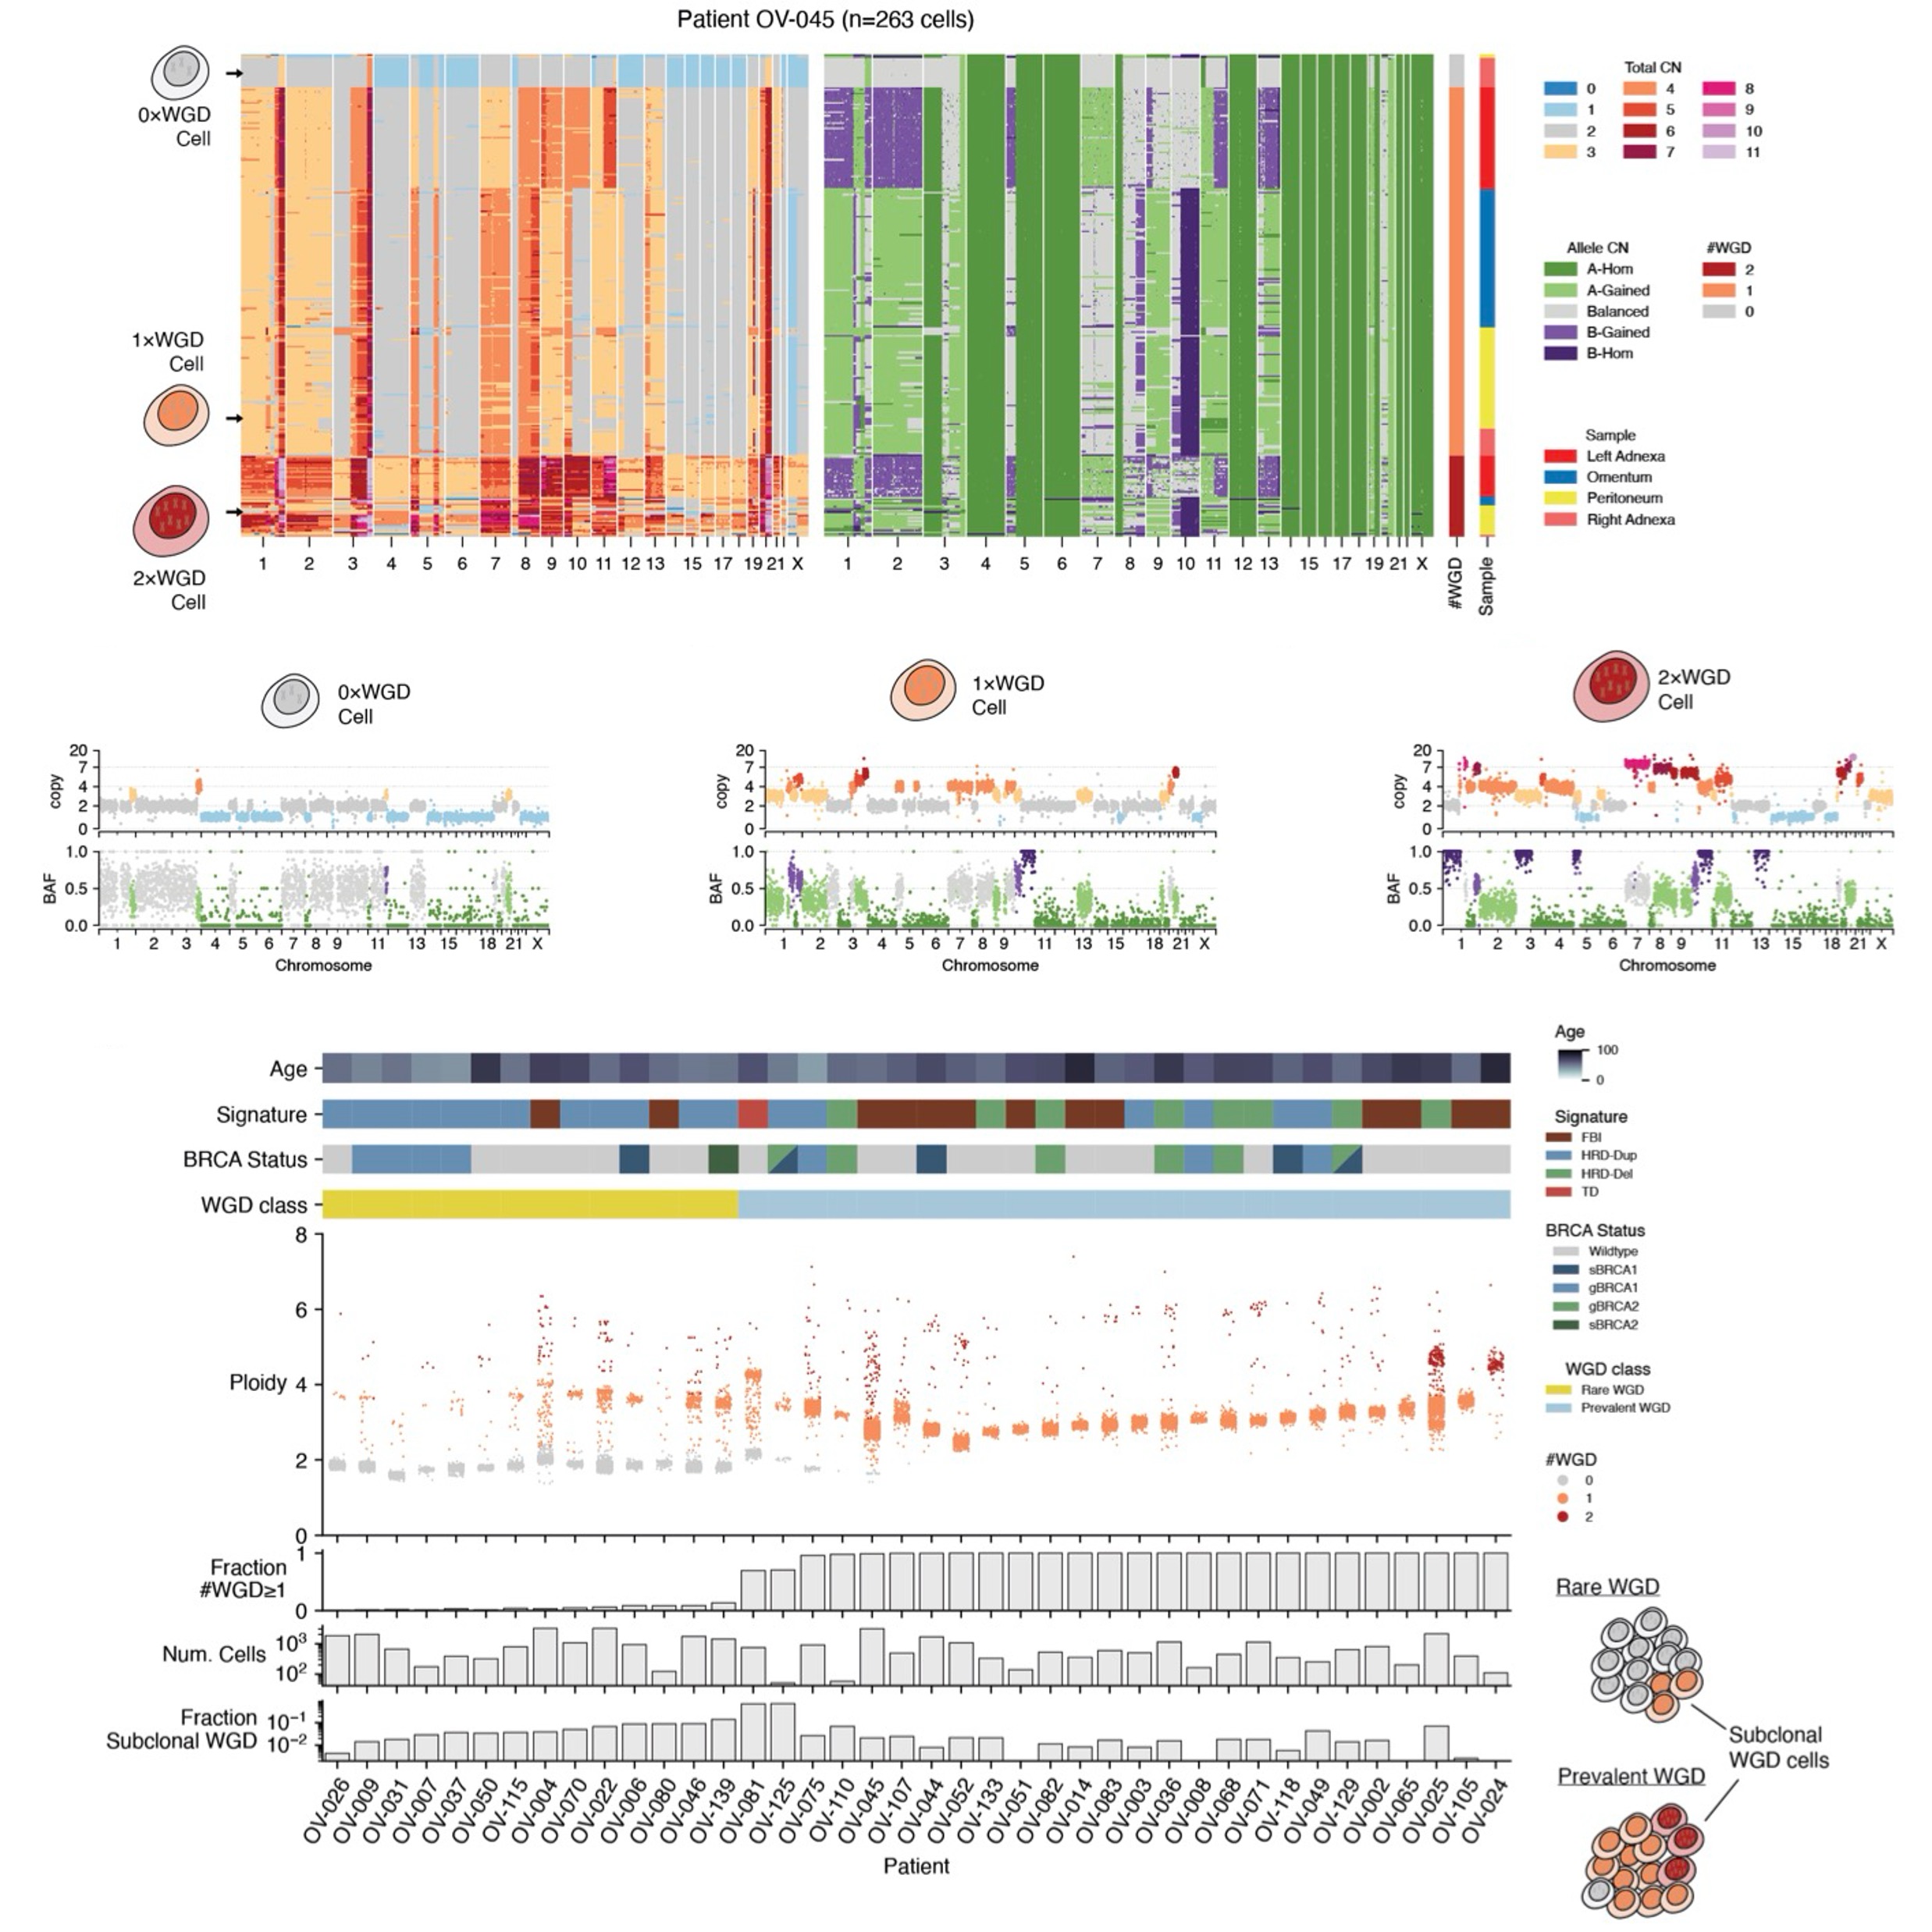
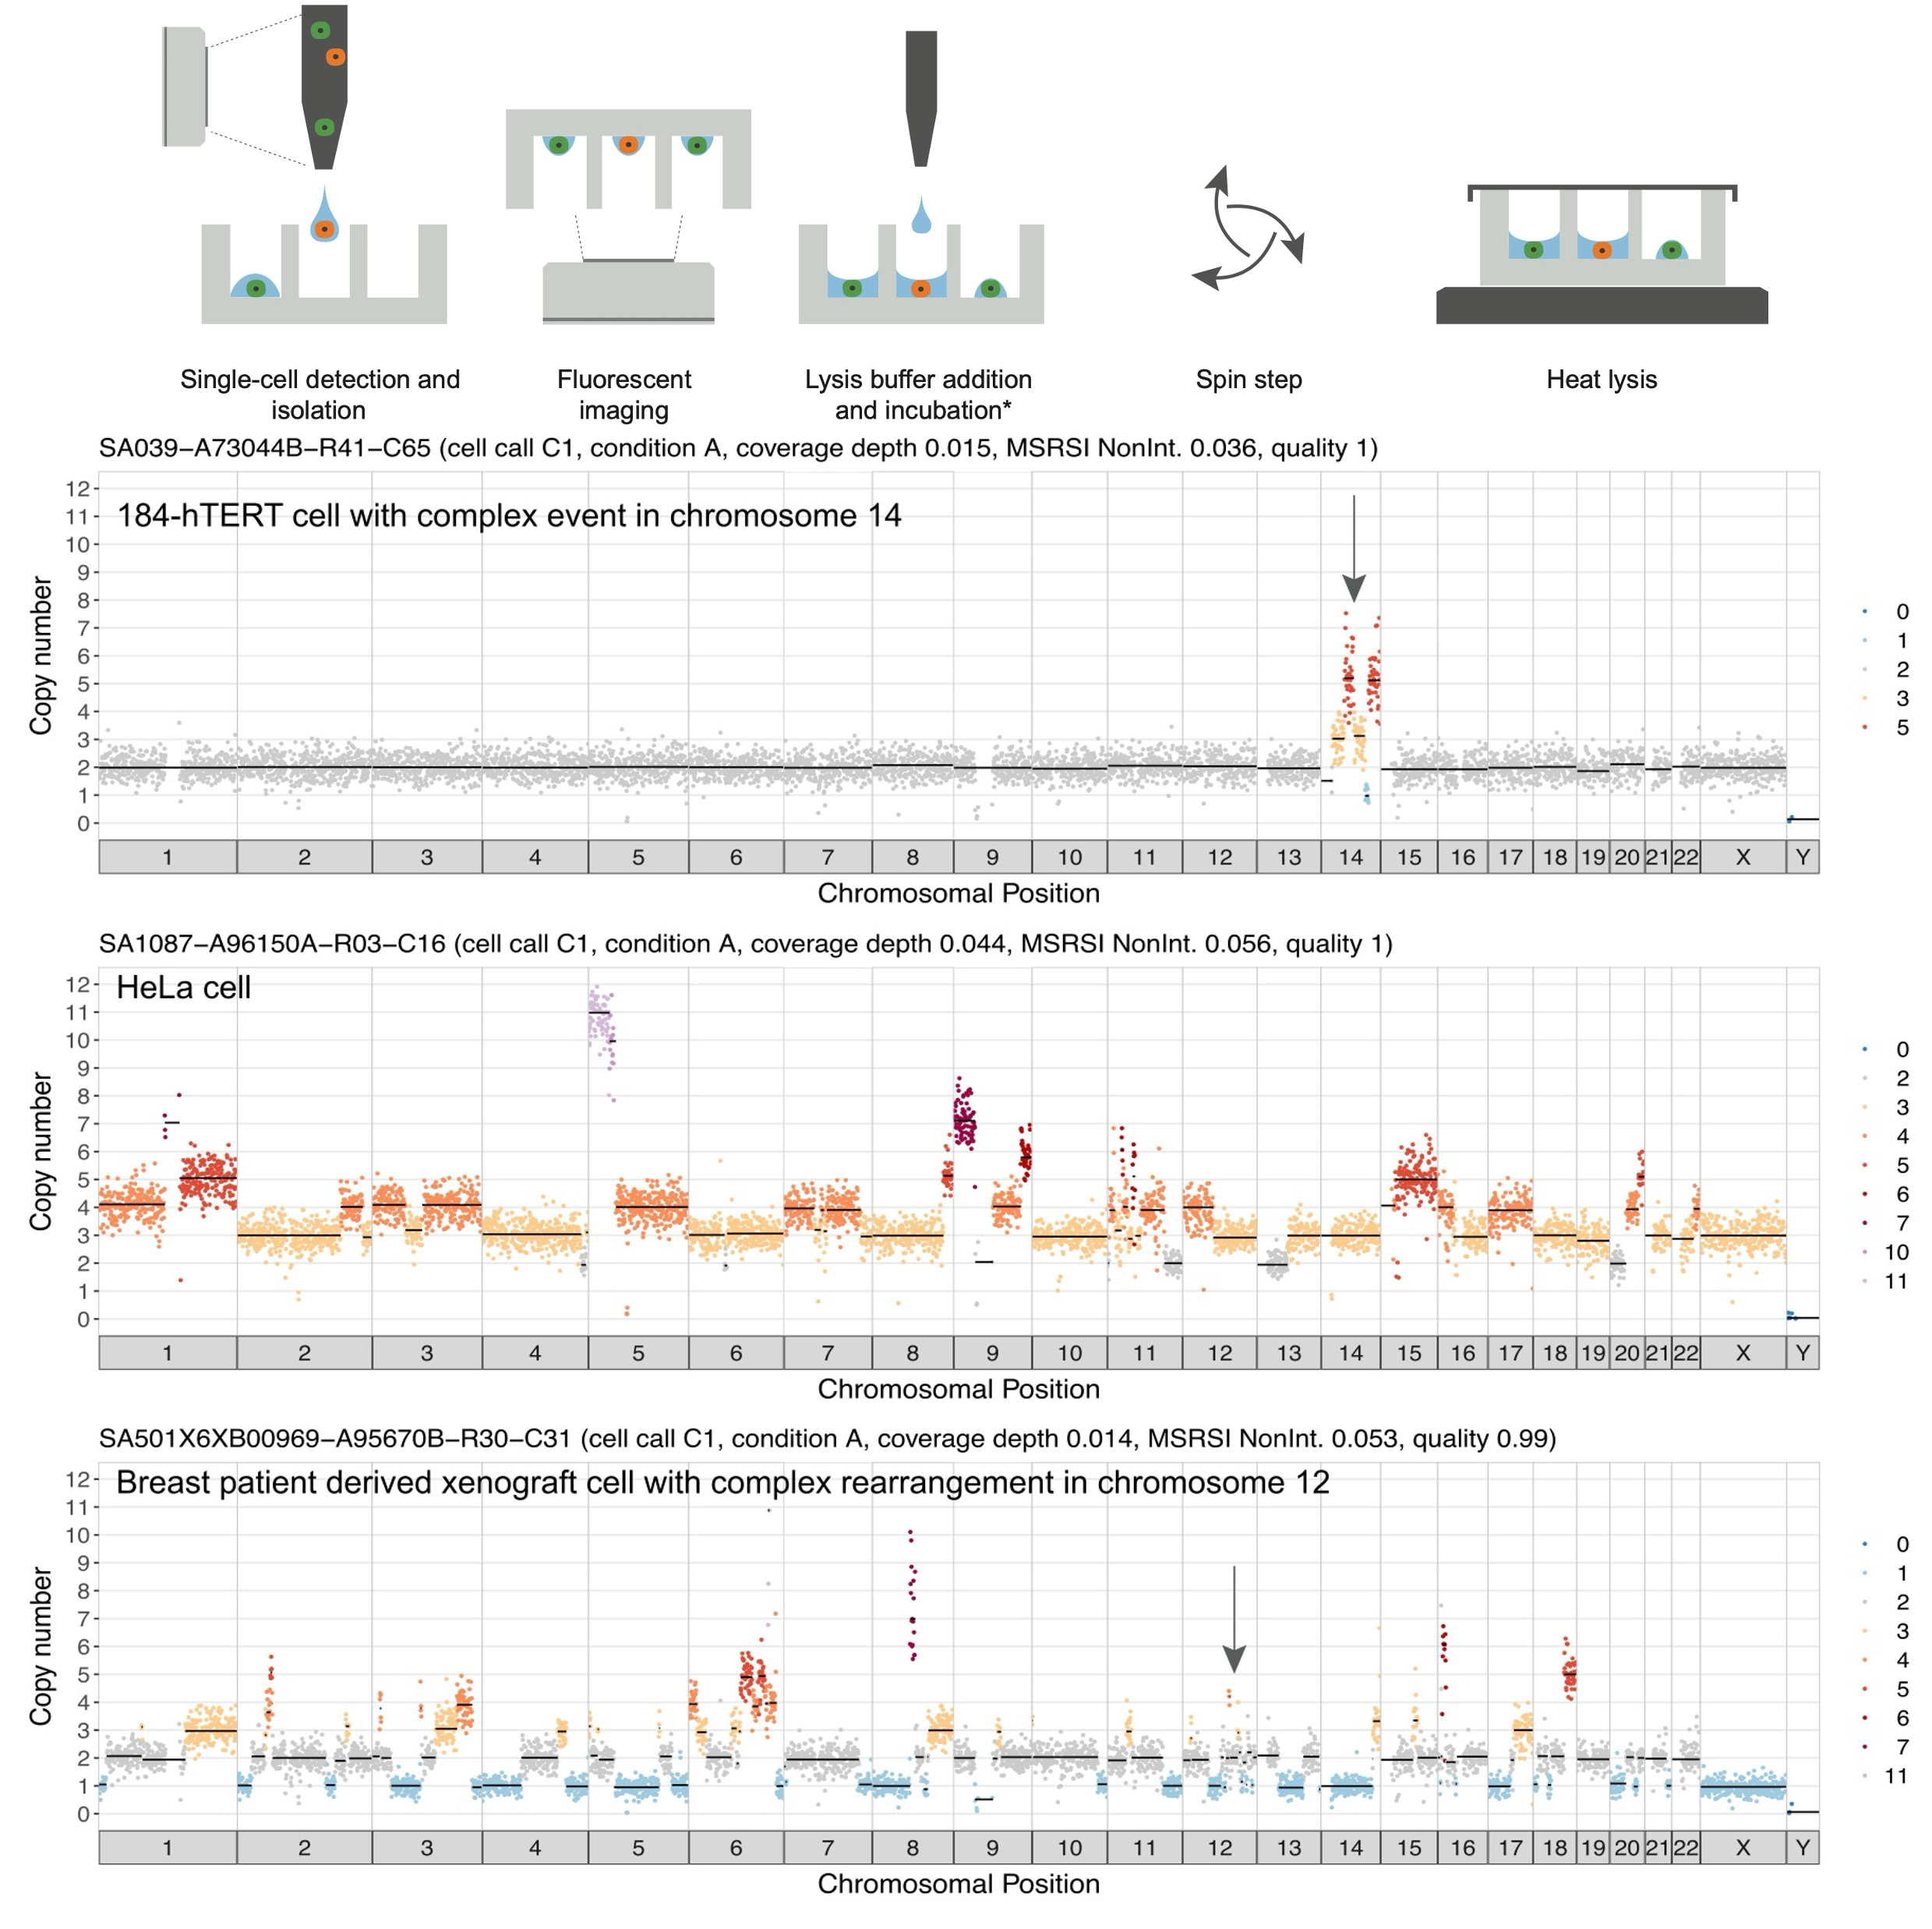
Recent developments in single-cell DNA-sequencing have provided an unparalleled view into the diversity and ongoing evolution within a tumor. Direct Library Development+ (DLP+), developed by the Sohrab Shah Lab, is capable of producing genomic information for tens of thousands of cells, without bias due to amplification or non-uniform coverage (Laks et al., 2019). Using DLP+, researchers have uncovered varying levels of CIN in different cancers, both between patients with the same tumor characteristic and across different cancer types.

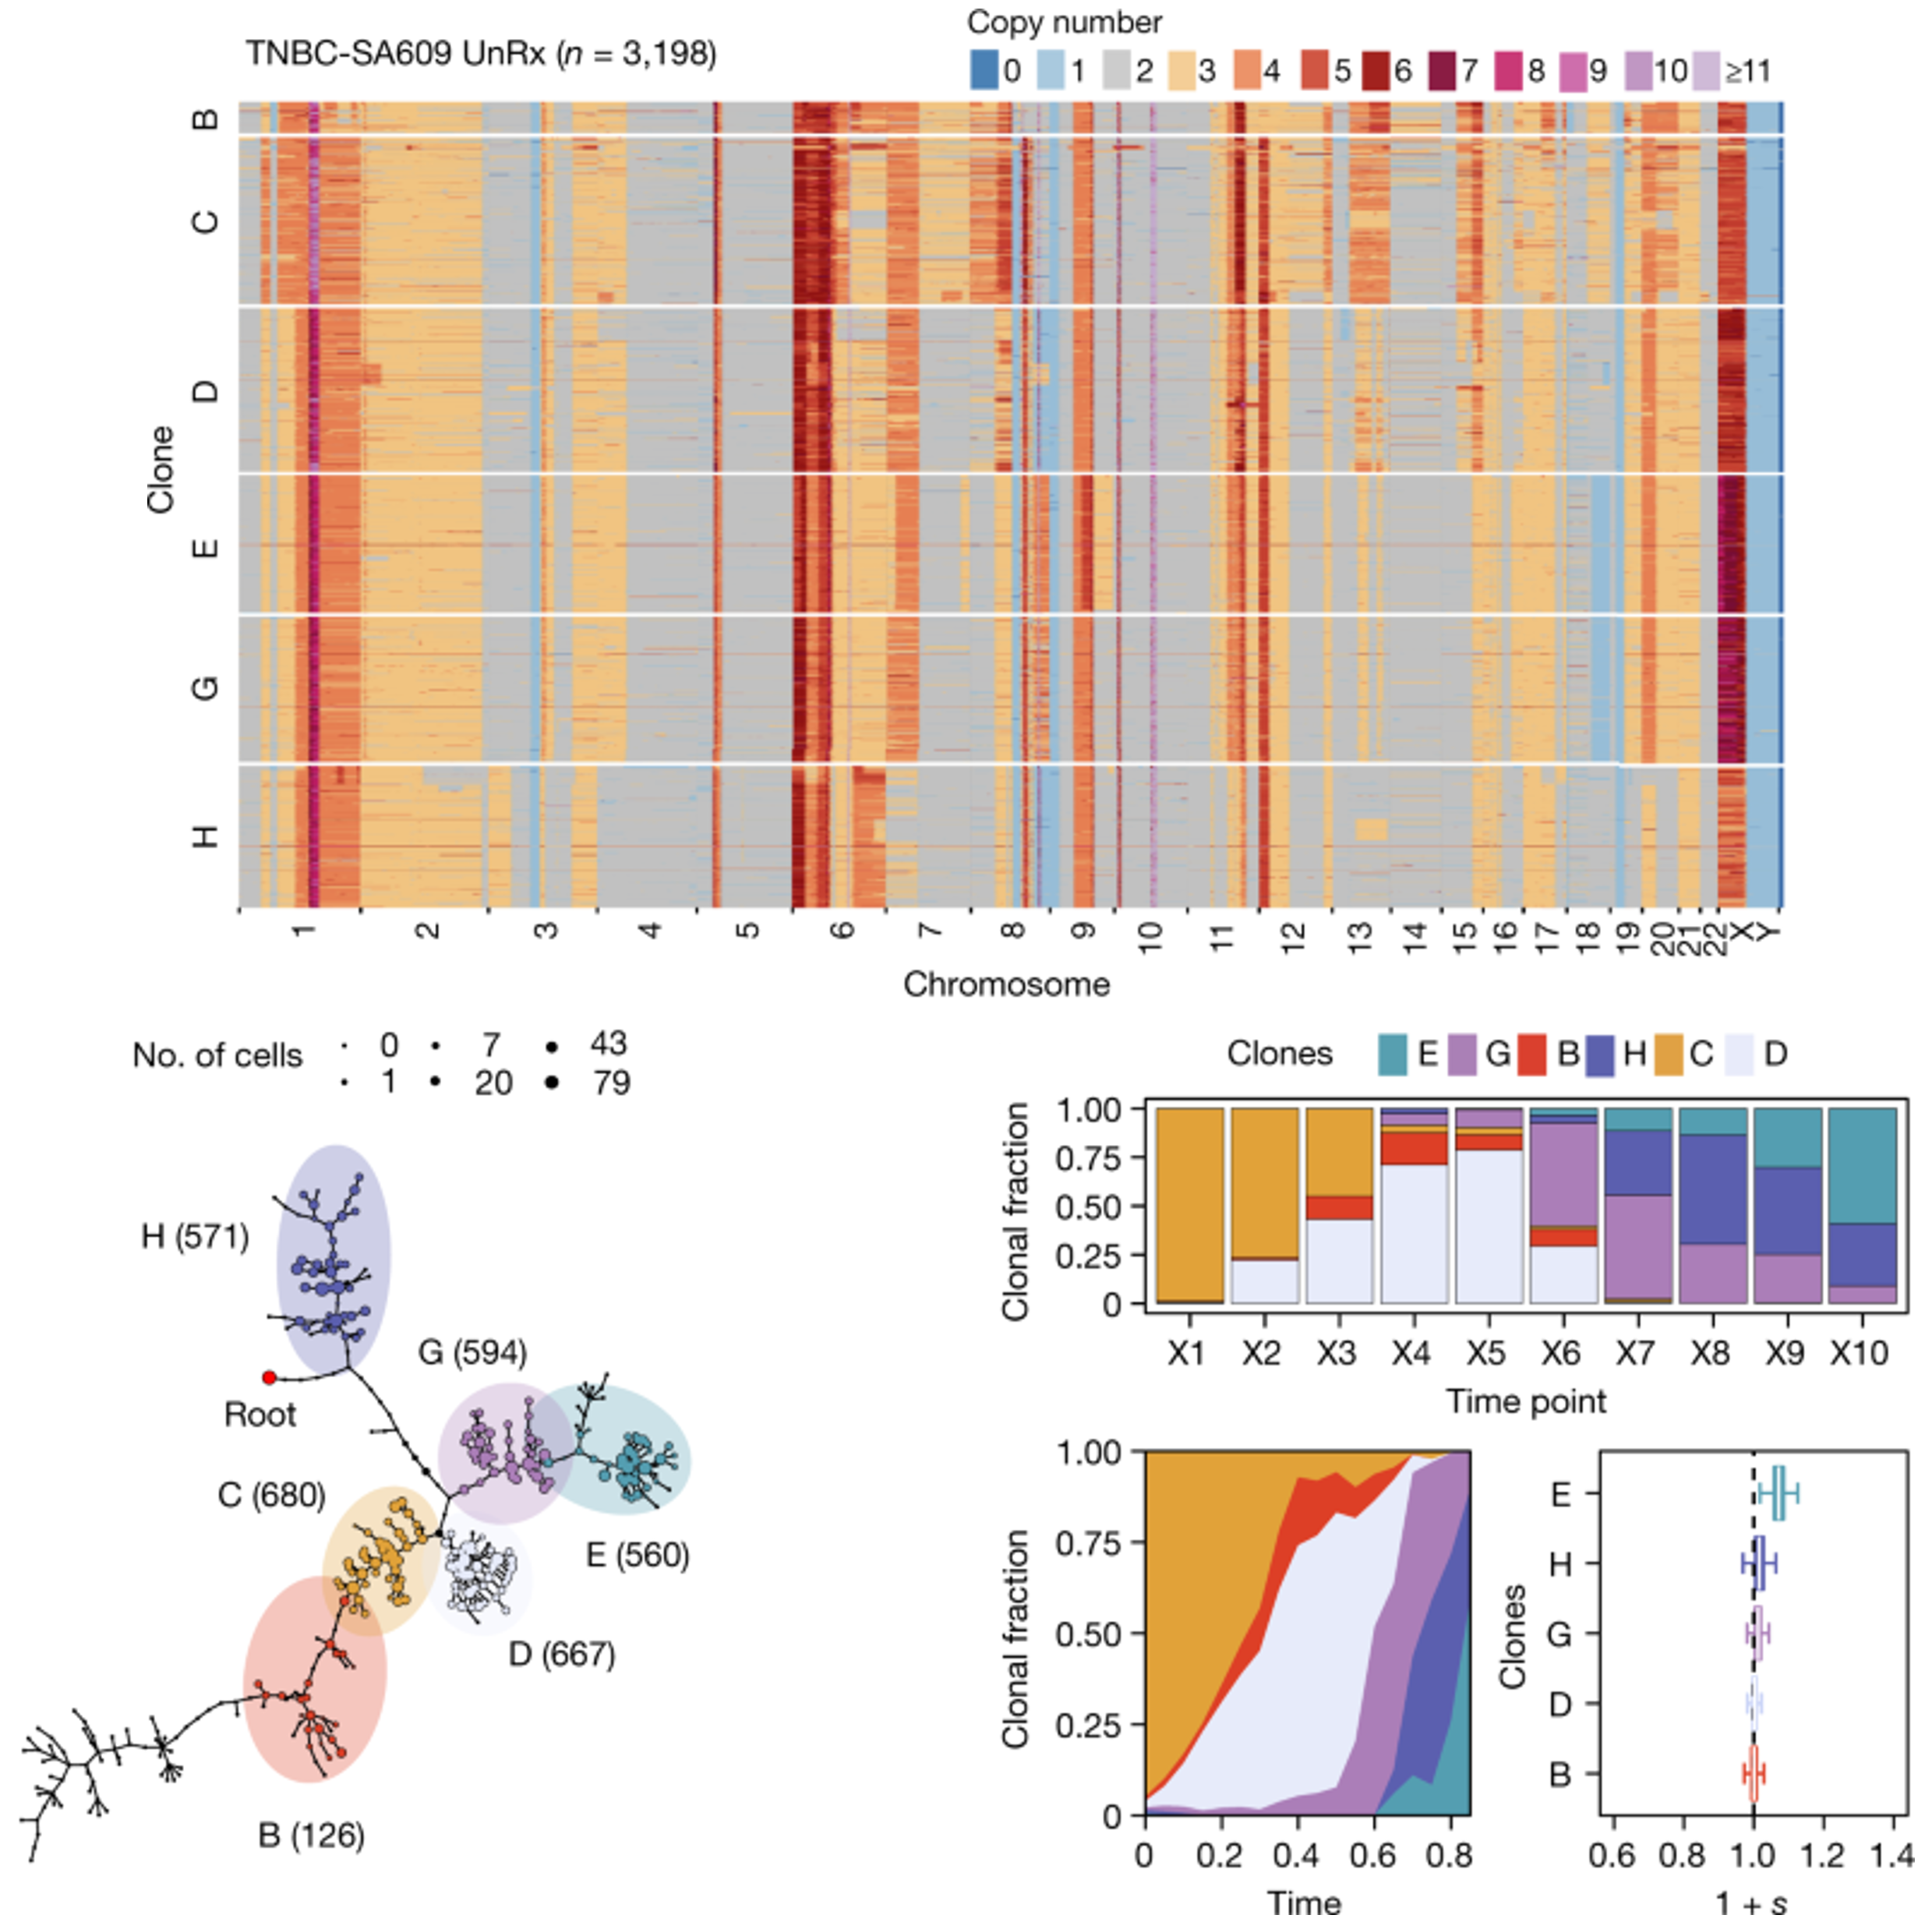
By grouping cells with similar copy numbers into clones and tracking them over time, DLP+ data provides a picture of competition between different clones. In some experiments, some clones were observed expanding through time, while others became extinct. This indicates that selection plays an important role during tumor growth, and certain CNAs are preferred over others as cancer progresses (Salehi et al., 2021).

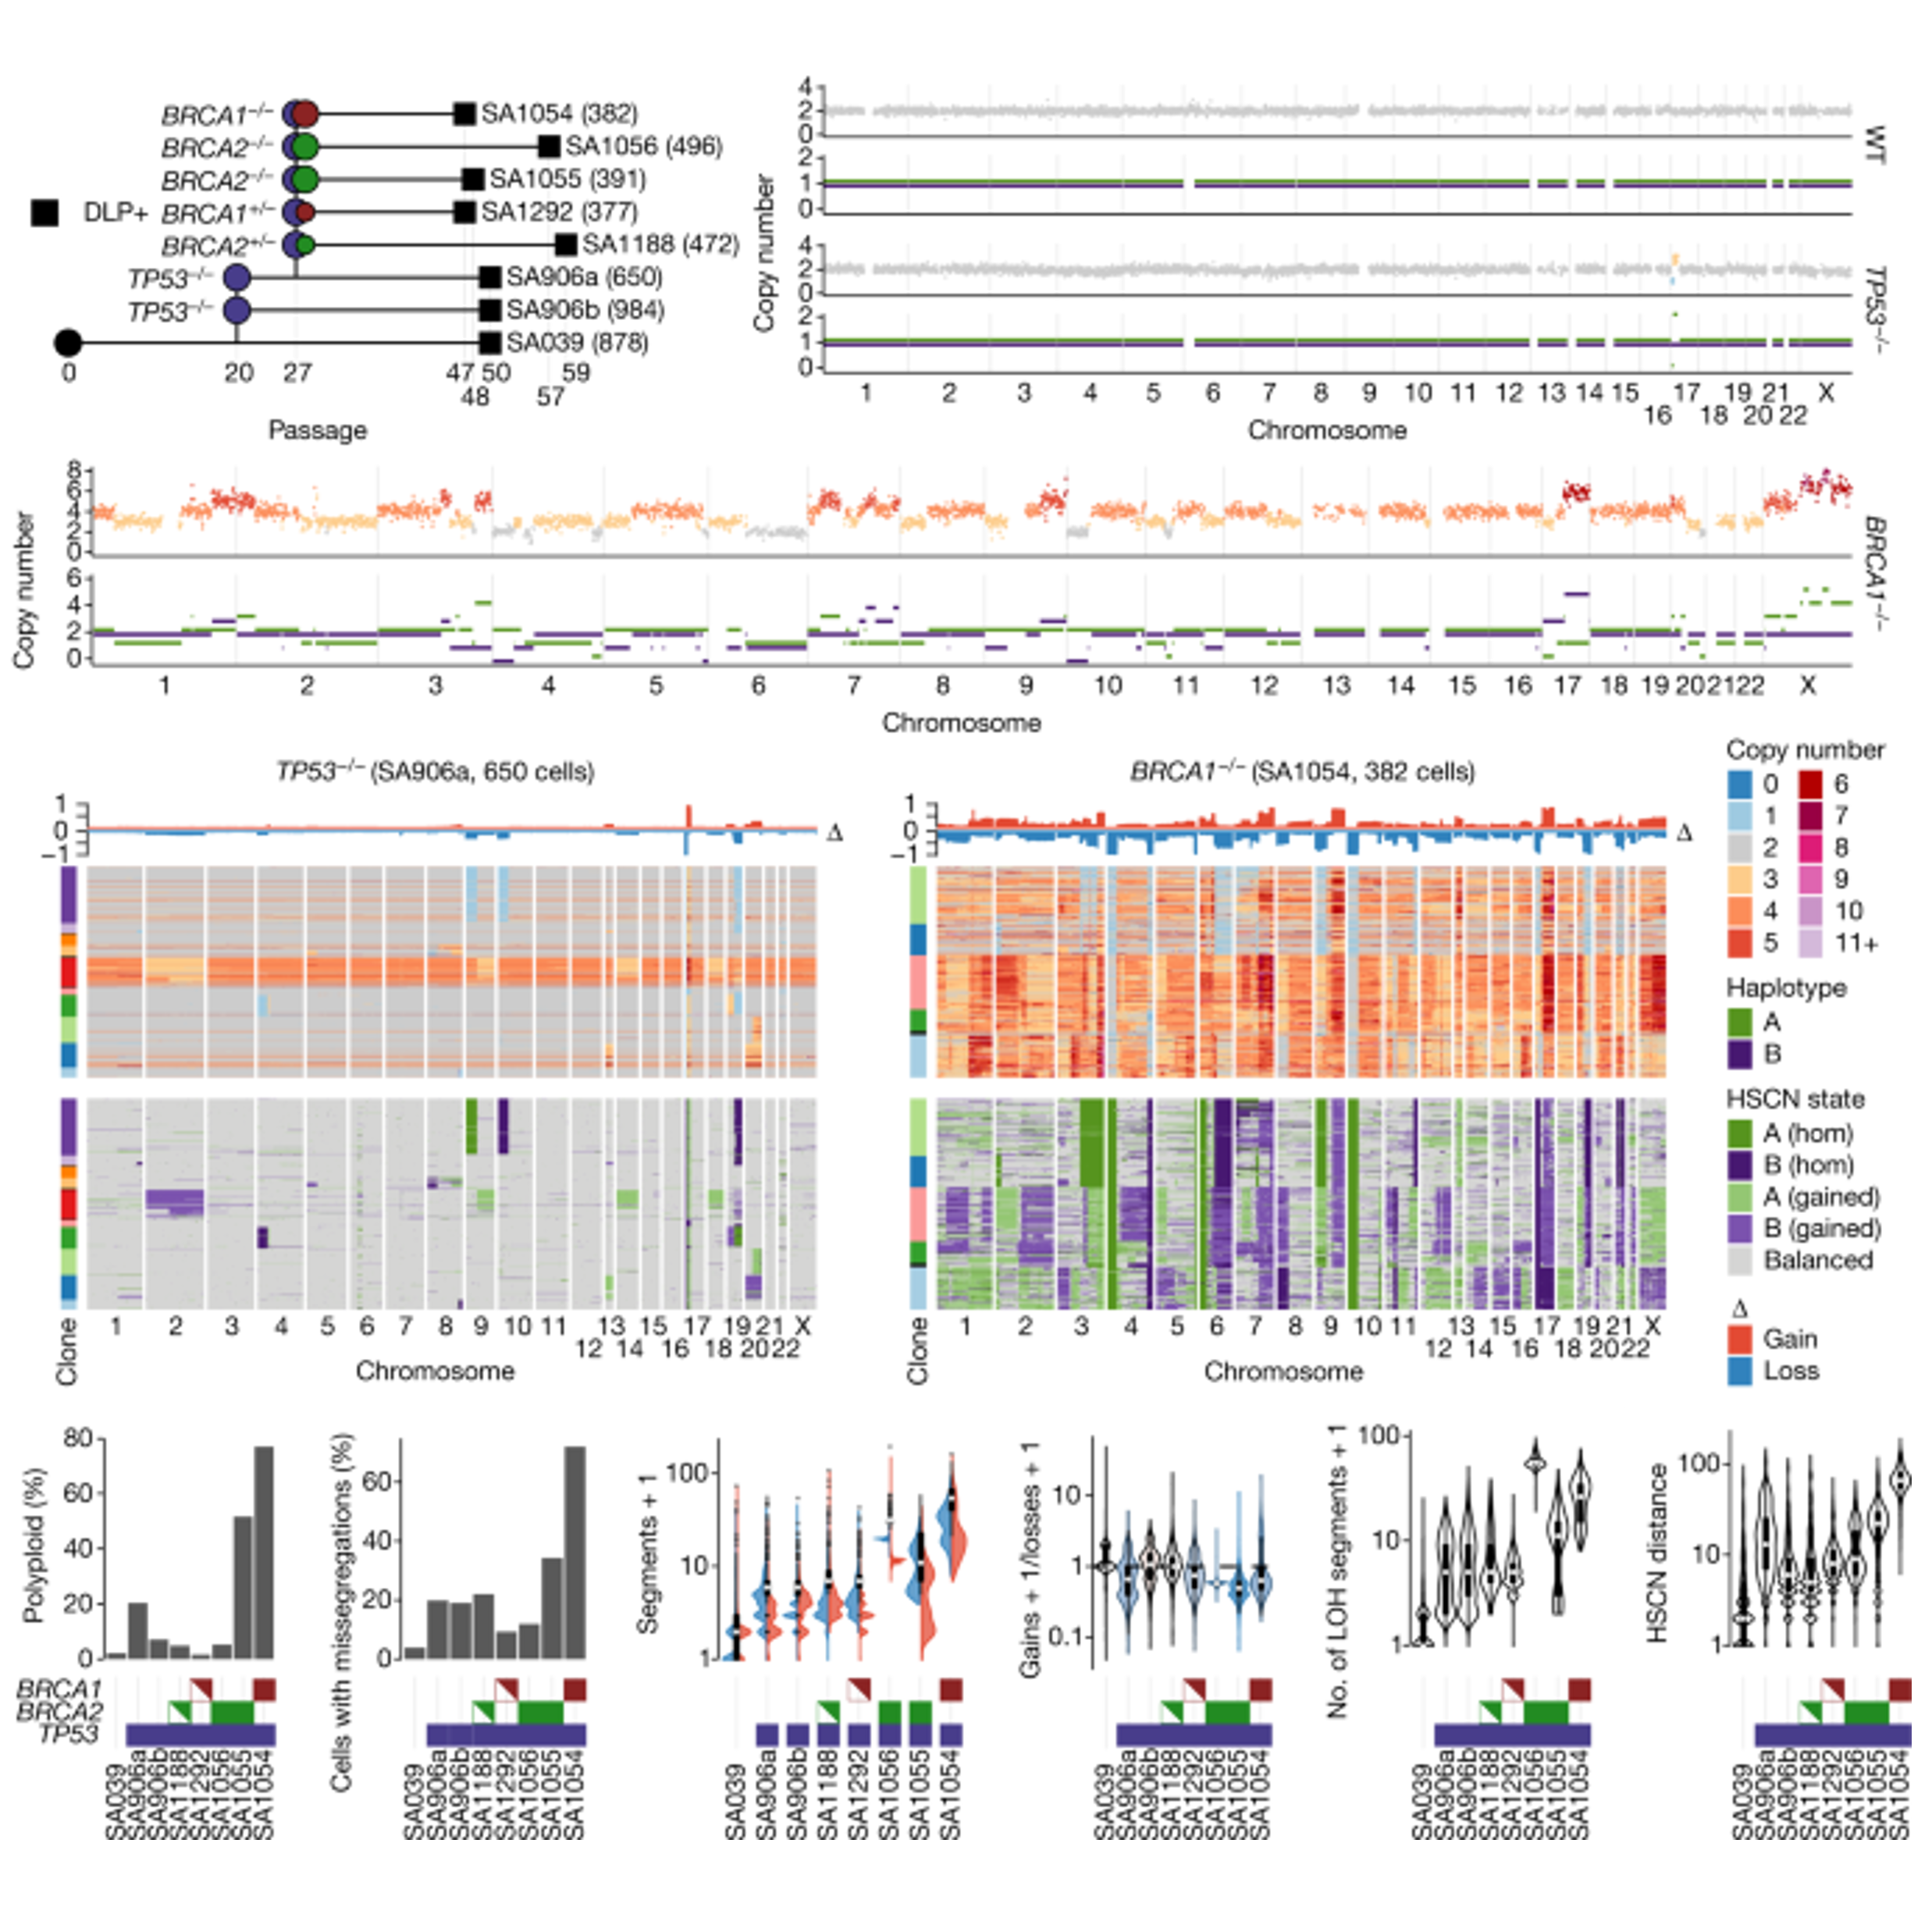
Furthermore, applications of DLP+ have led to the realization that knock-outs of certain important genes, such as TP53 and BRCA1/2 in the mammary epithelium, are associated with a significant increase in CIN (Funnell et al., 2022). This manifests in higher number of polyploid cells (resulting from whole-genome duplications) and more chromosome missegregations. These results explain the high numbers of CNAs that have been observed in ovarian and breast cancers.
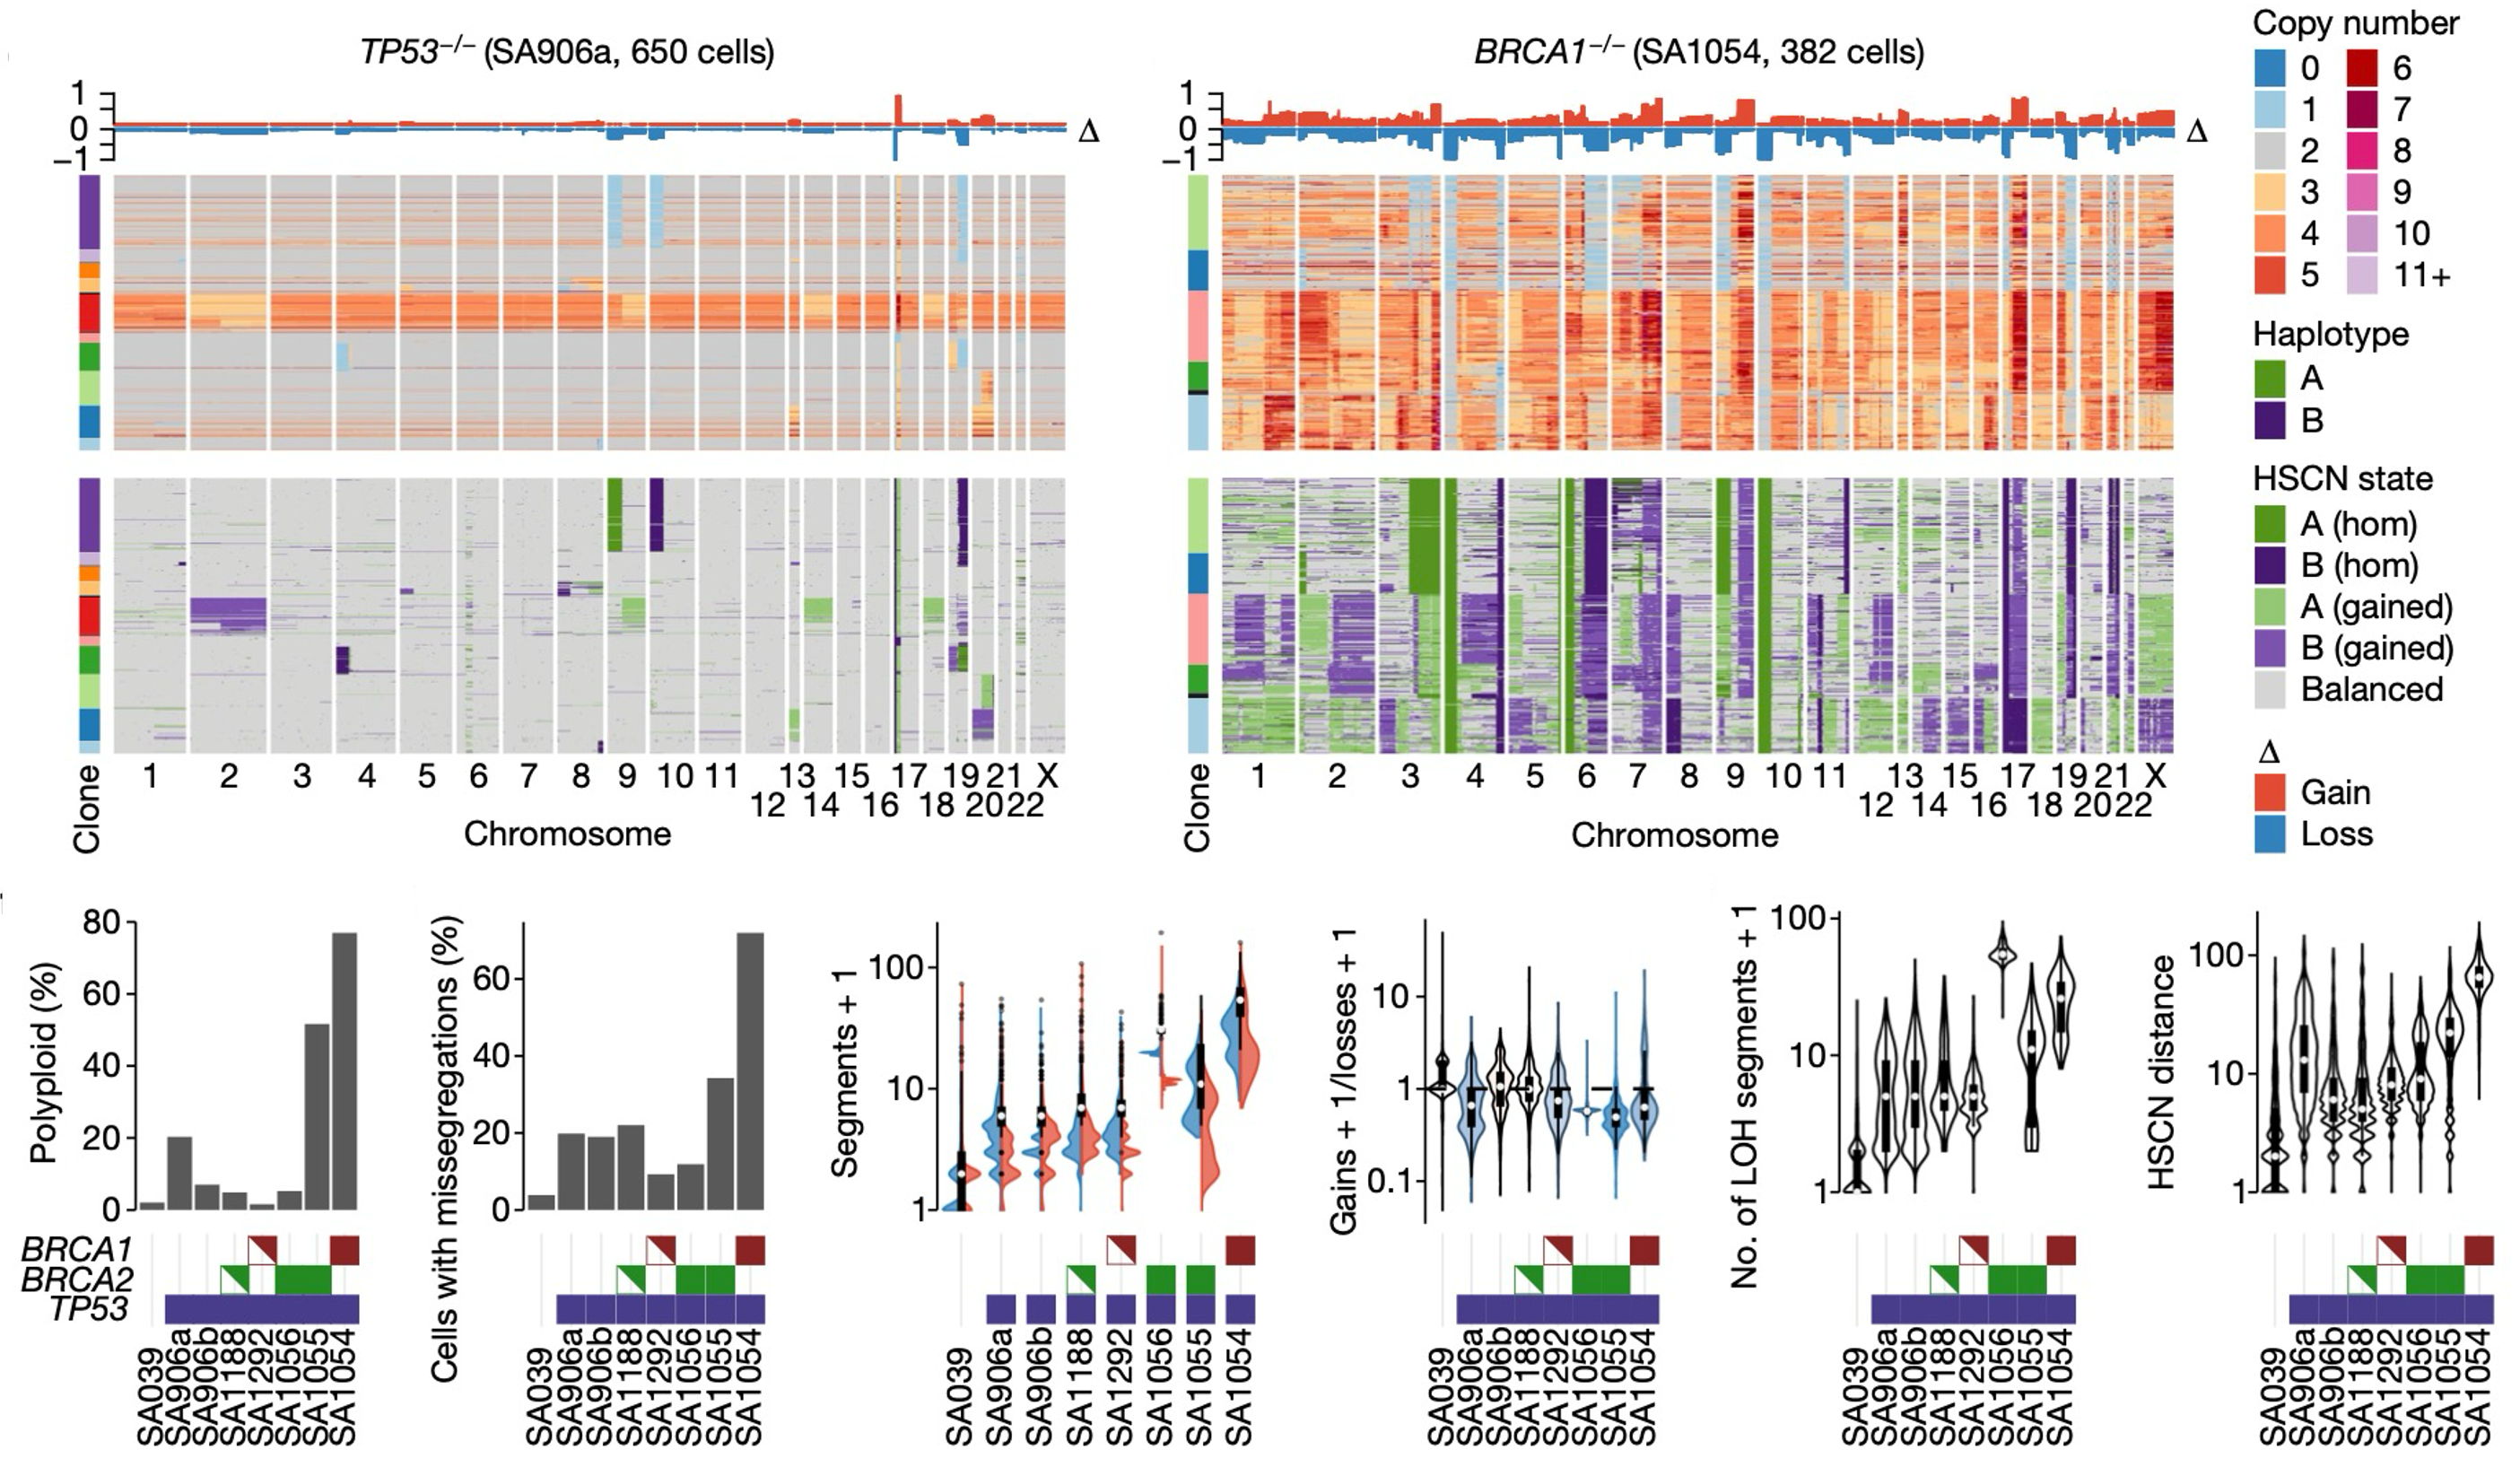
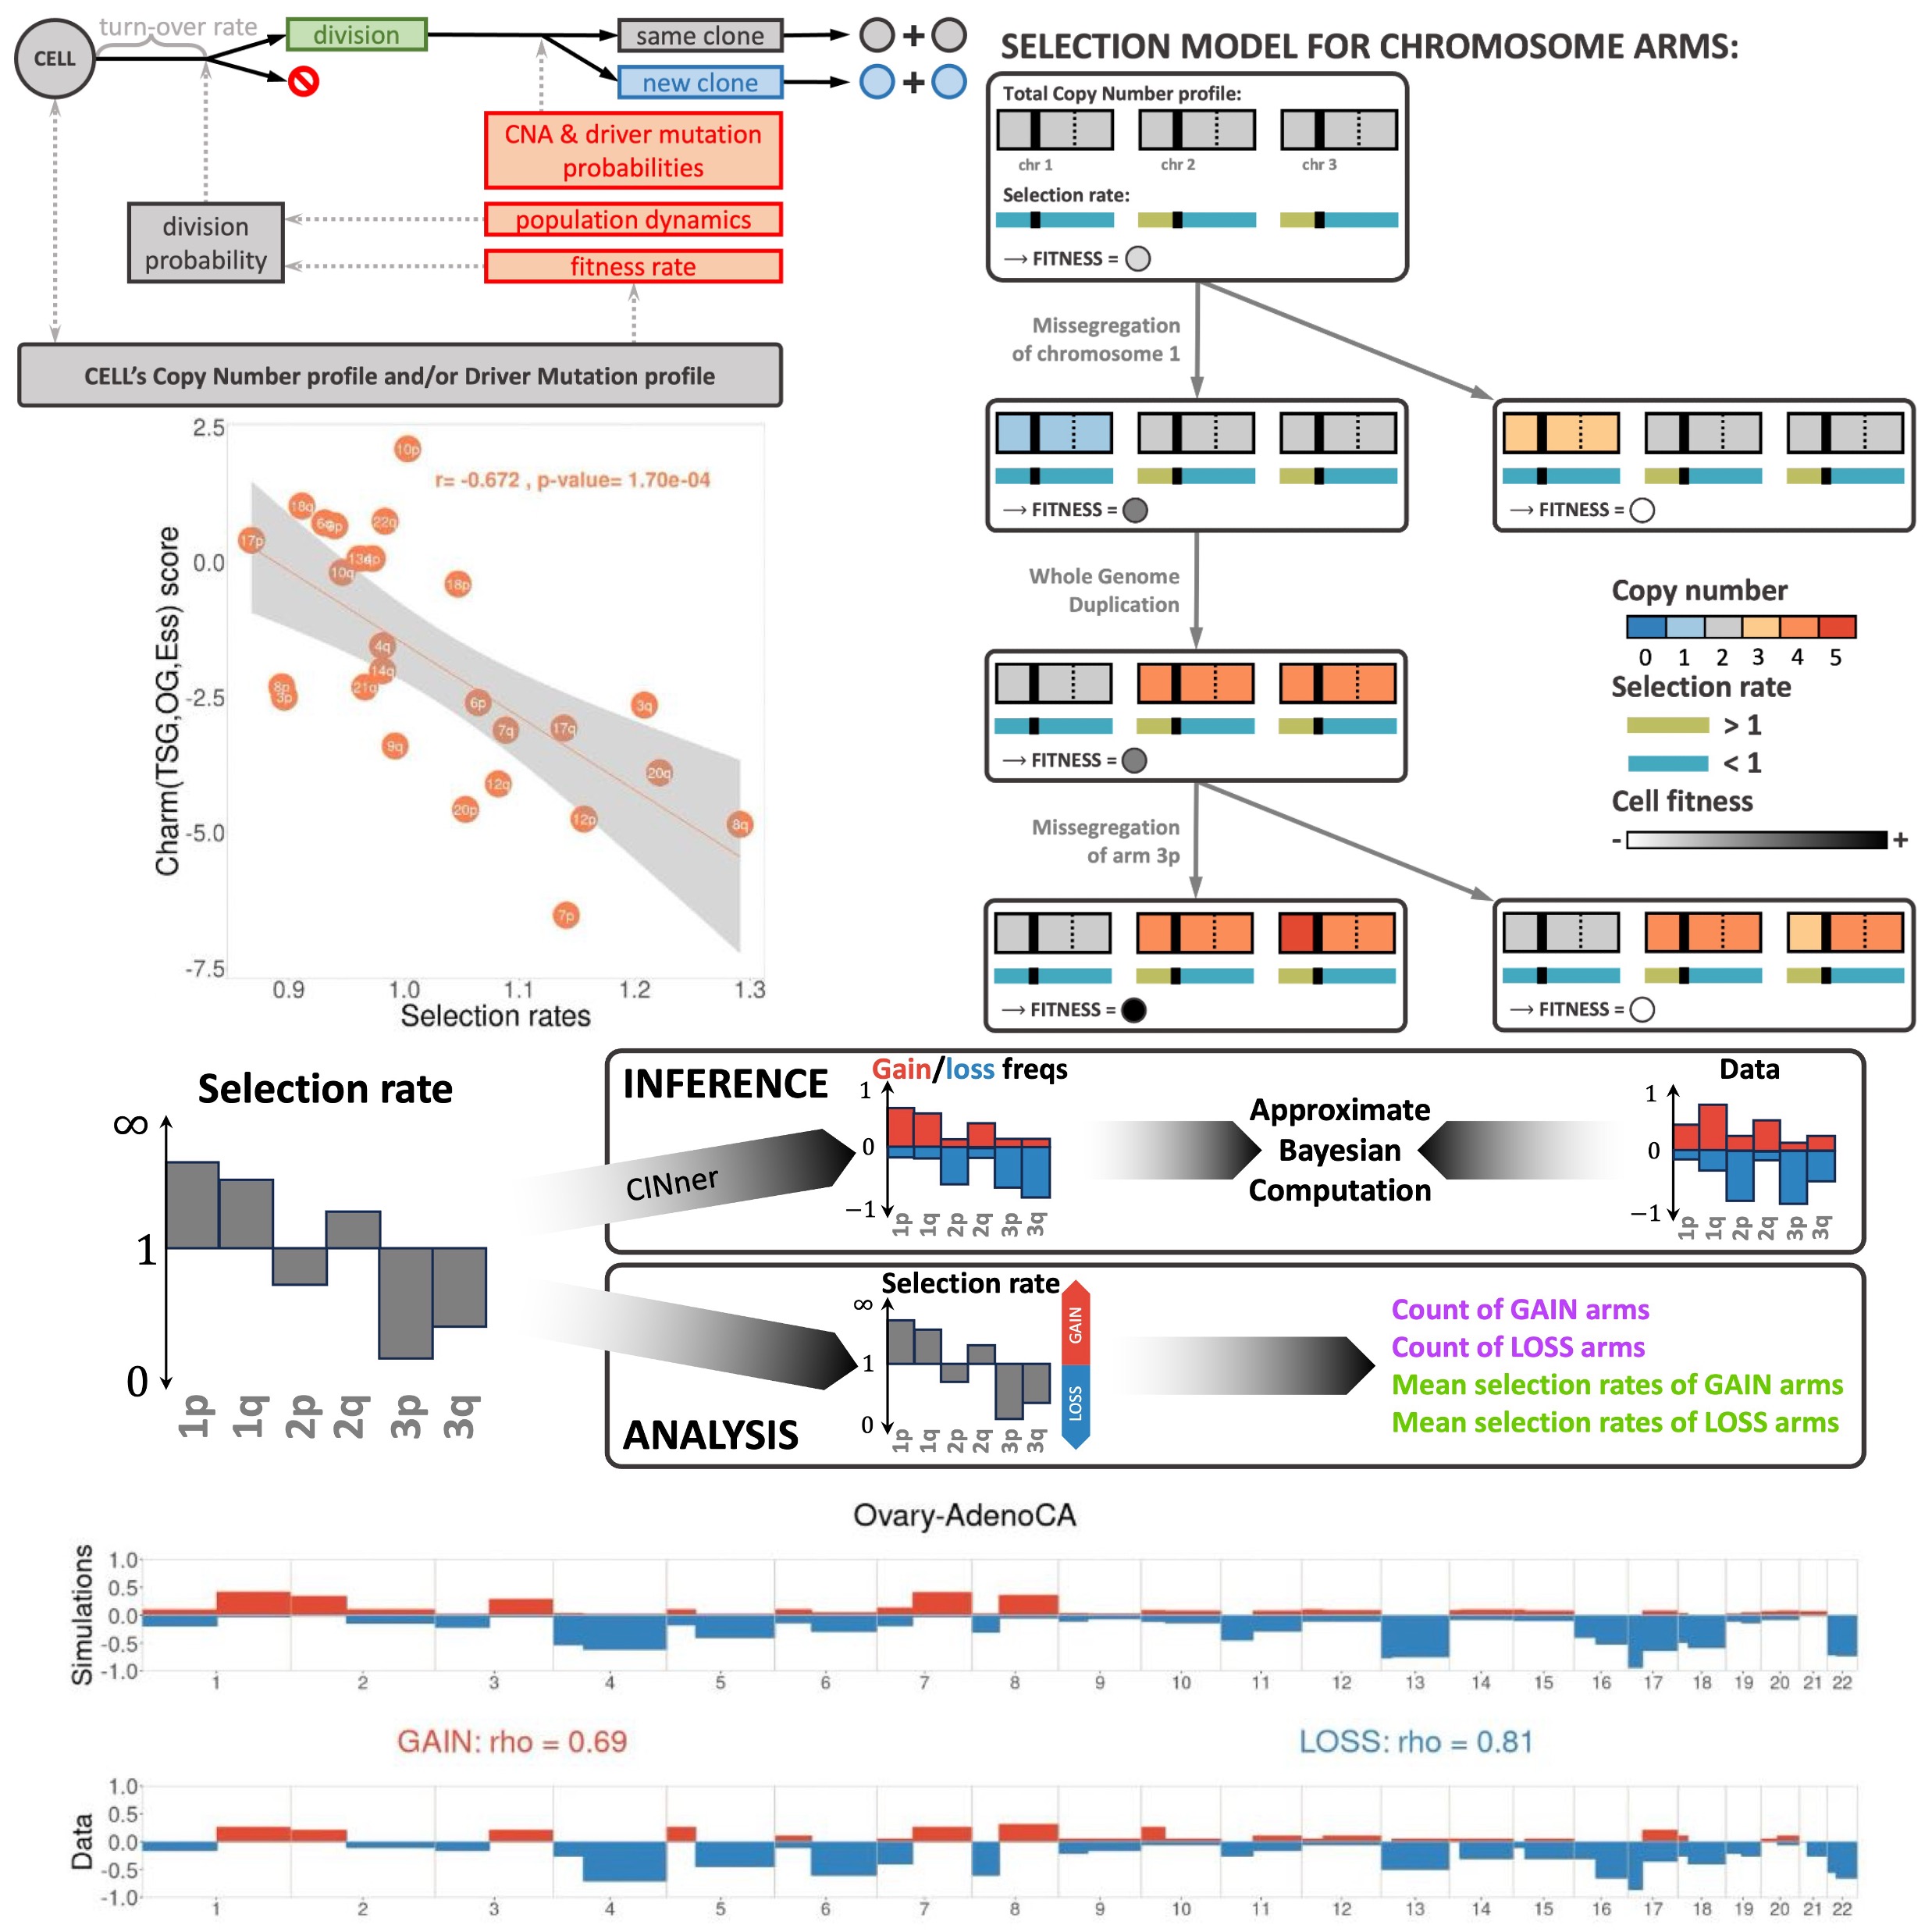
We seek to systematically study how CIN arises and affects the selection landscape during tumor growth. This requires a mathematical framework that incorporates different CNA mechanisms that occur during CIN. We developed CINner, an algorithm to simulate how CIN arises and affects the selection landscape during cancer growth (Dinh et al., 2025). CINner, available as an R package on Github, is designed to efficiently model a cell population undergoing different types of CNAs and mutations, which change the cell karyotypes and increase the clonal diversity.
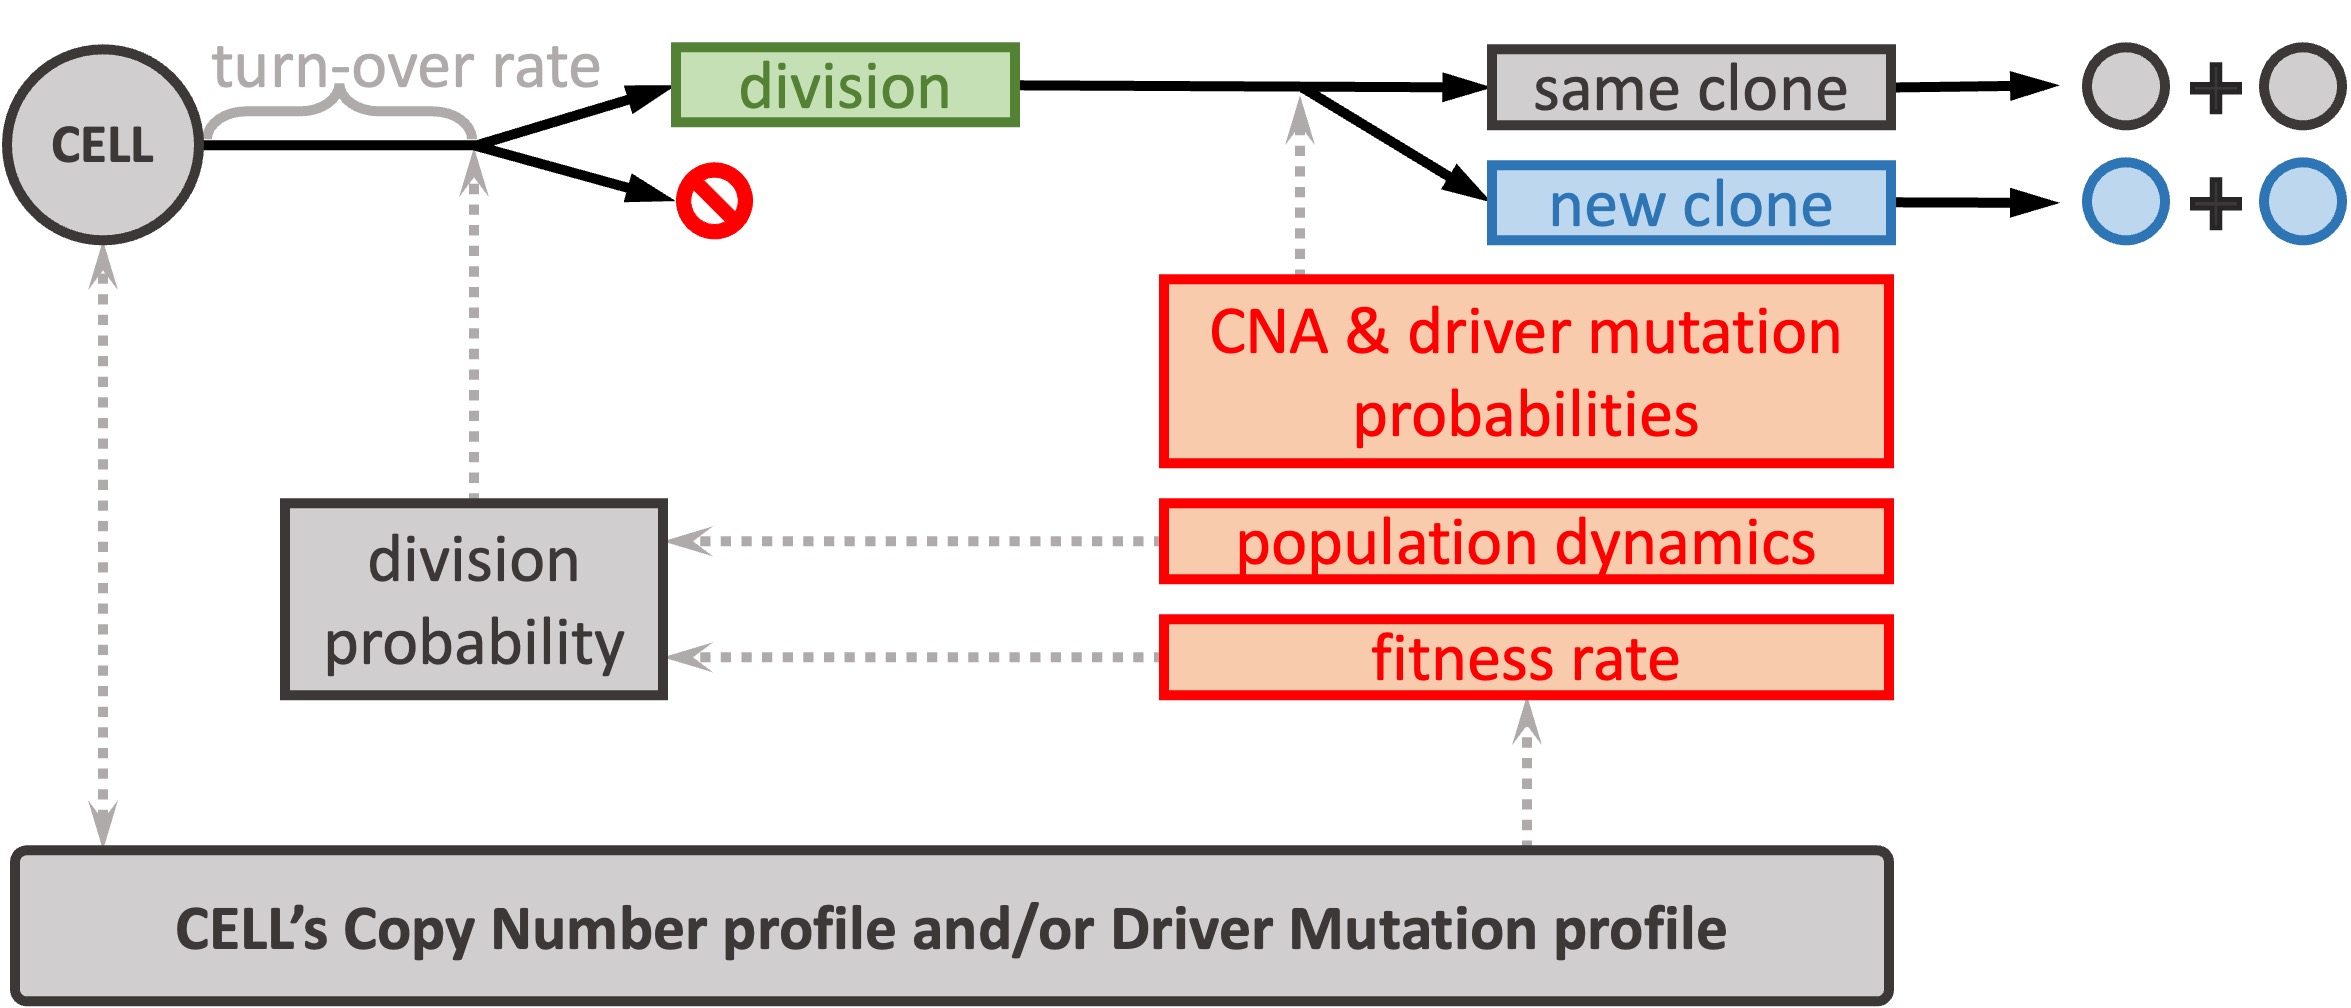
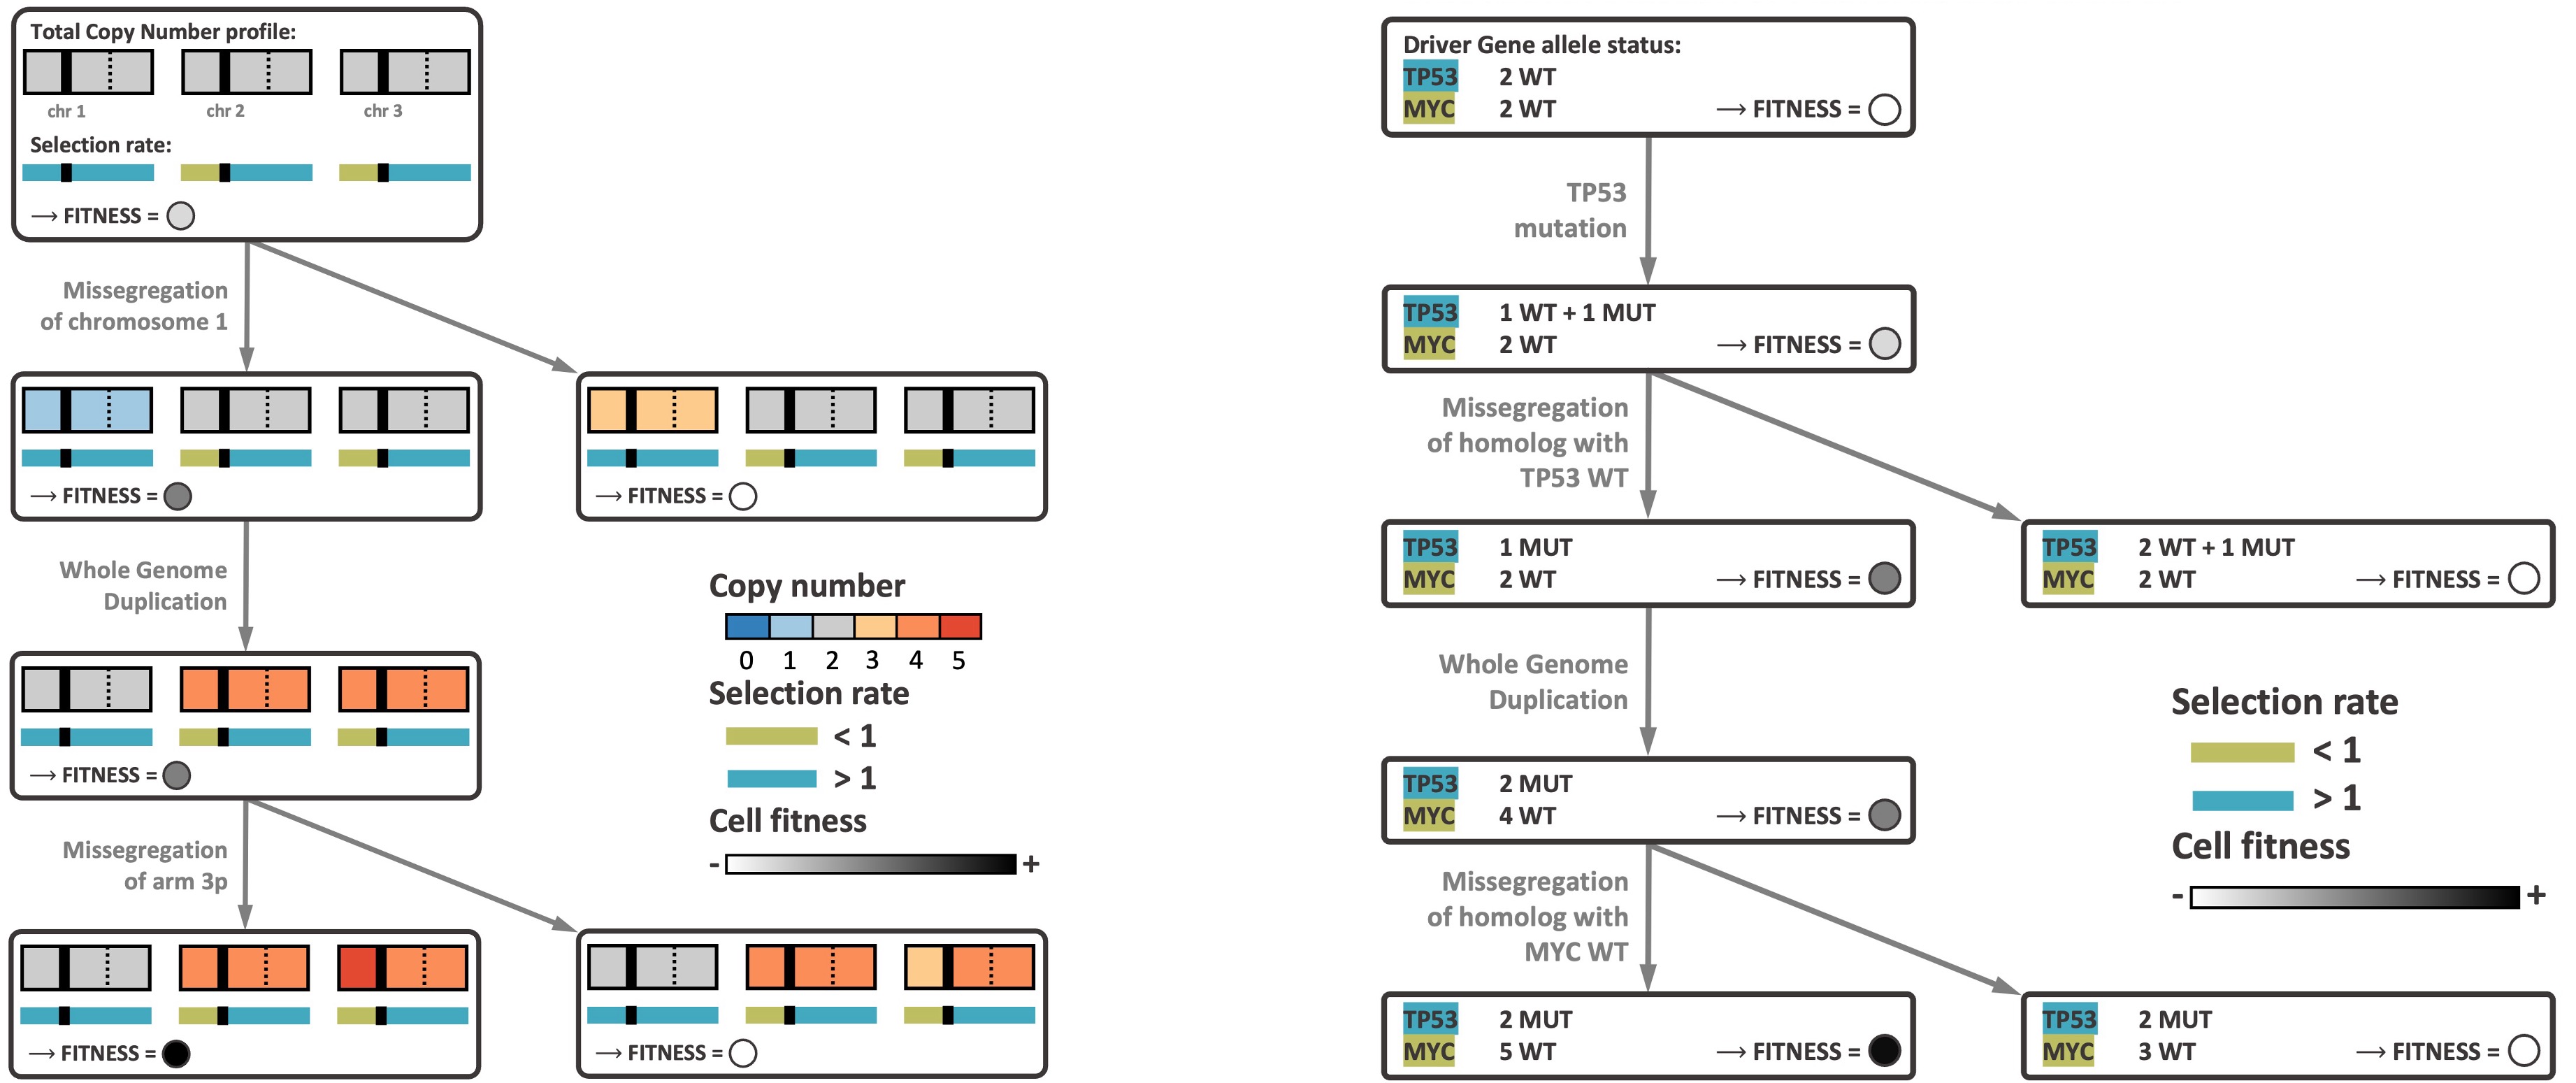
CINner currently supports different CNA mechanisms, including whole-genome duplications, whole-chromosome and chromosome-arm missegregations, focal amplifications and deletions. We included three different selection models, designed to quantify the fitness of chromosome-arm level CNAs or driver mutations, or both.
When applied to whole genome sequencing data across all cancers in The Cancer Genome Atlas (TCGA), CINner inferred selection parameters for individual chromosome arms. These selection parameters strongly correlate with the gene imbalance on each arm from Davoli et al., indicating that selection rates inferred from CINner are estimates for the combined effects of genes located on different genomic regions.
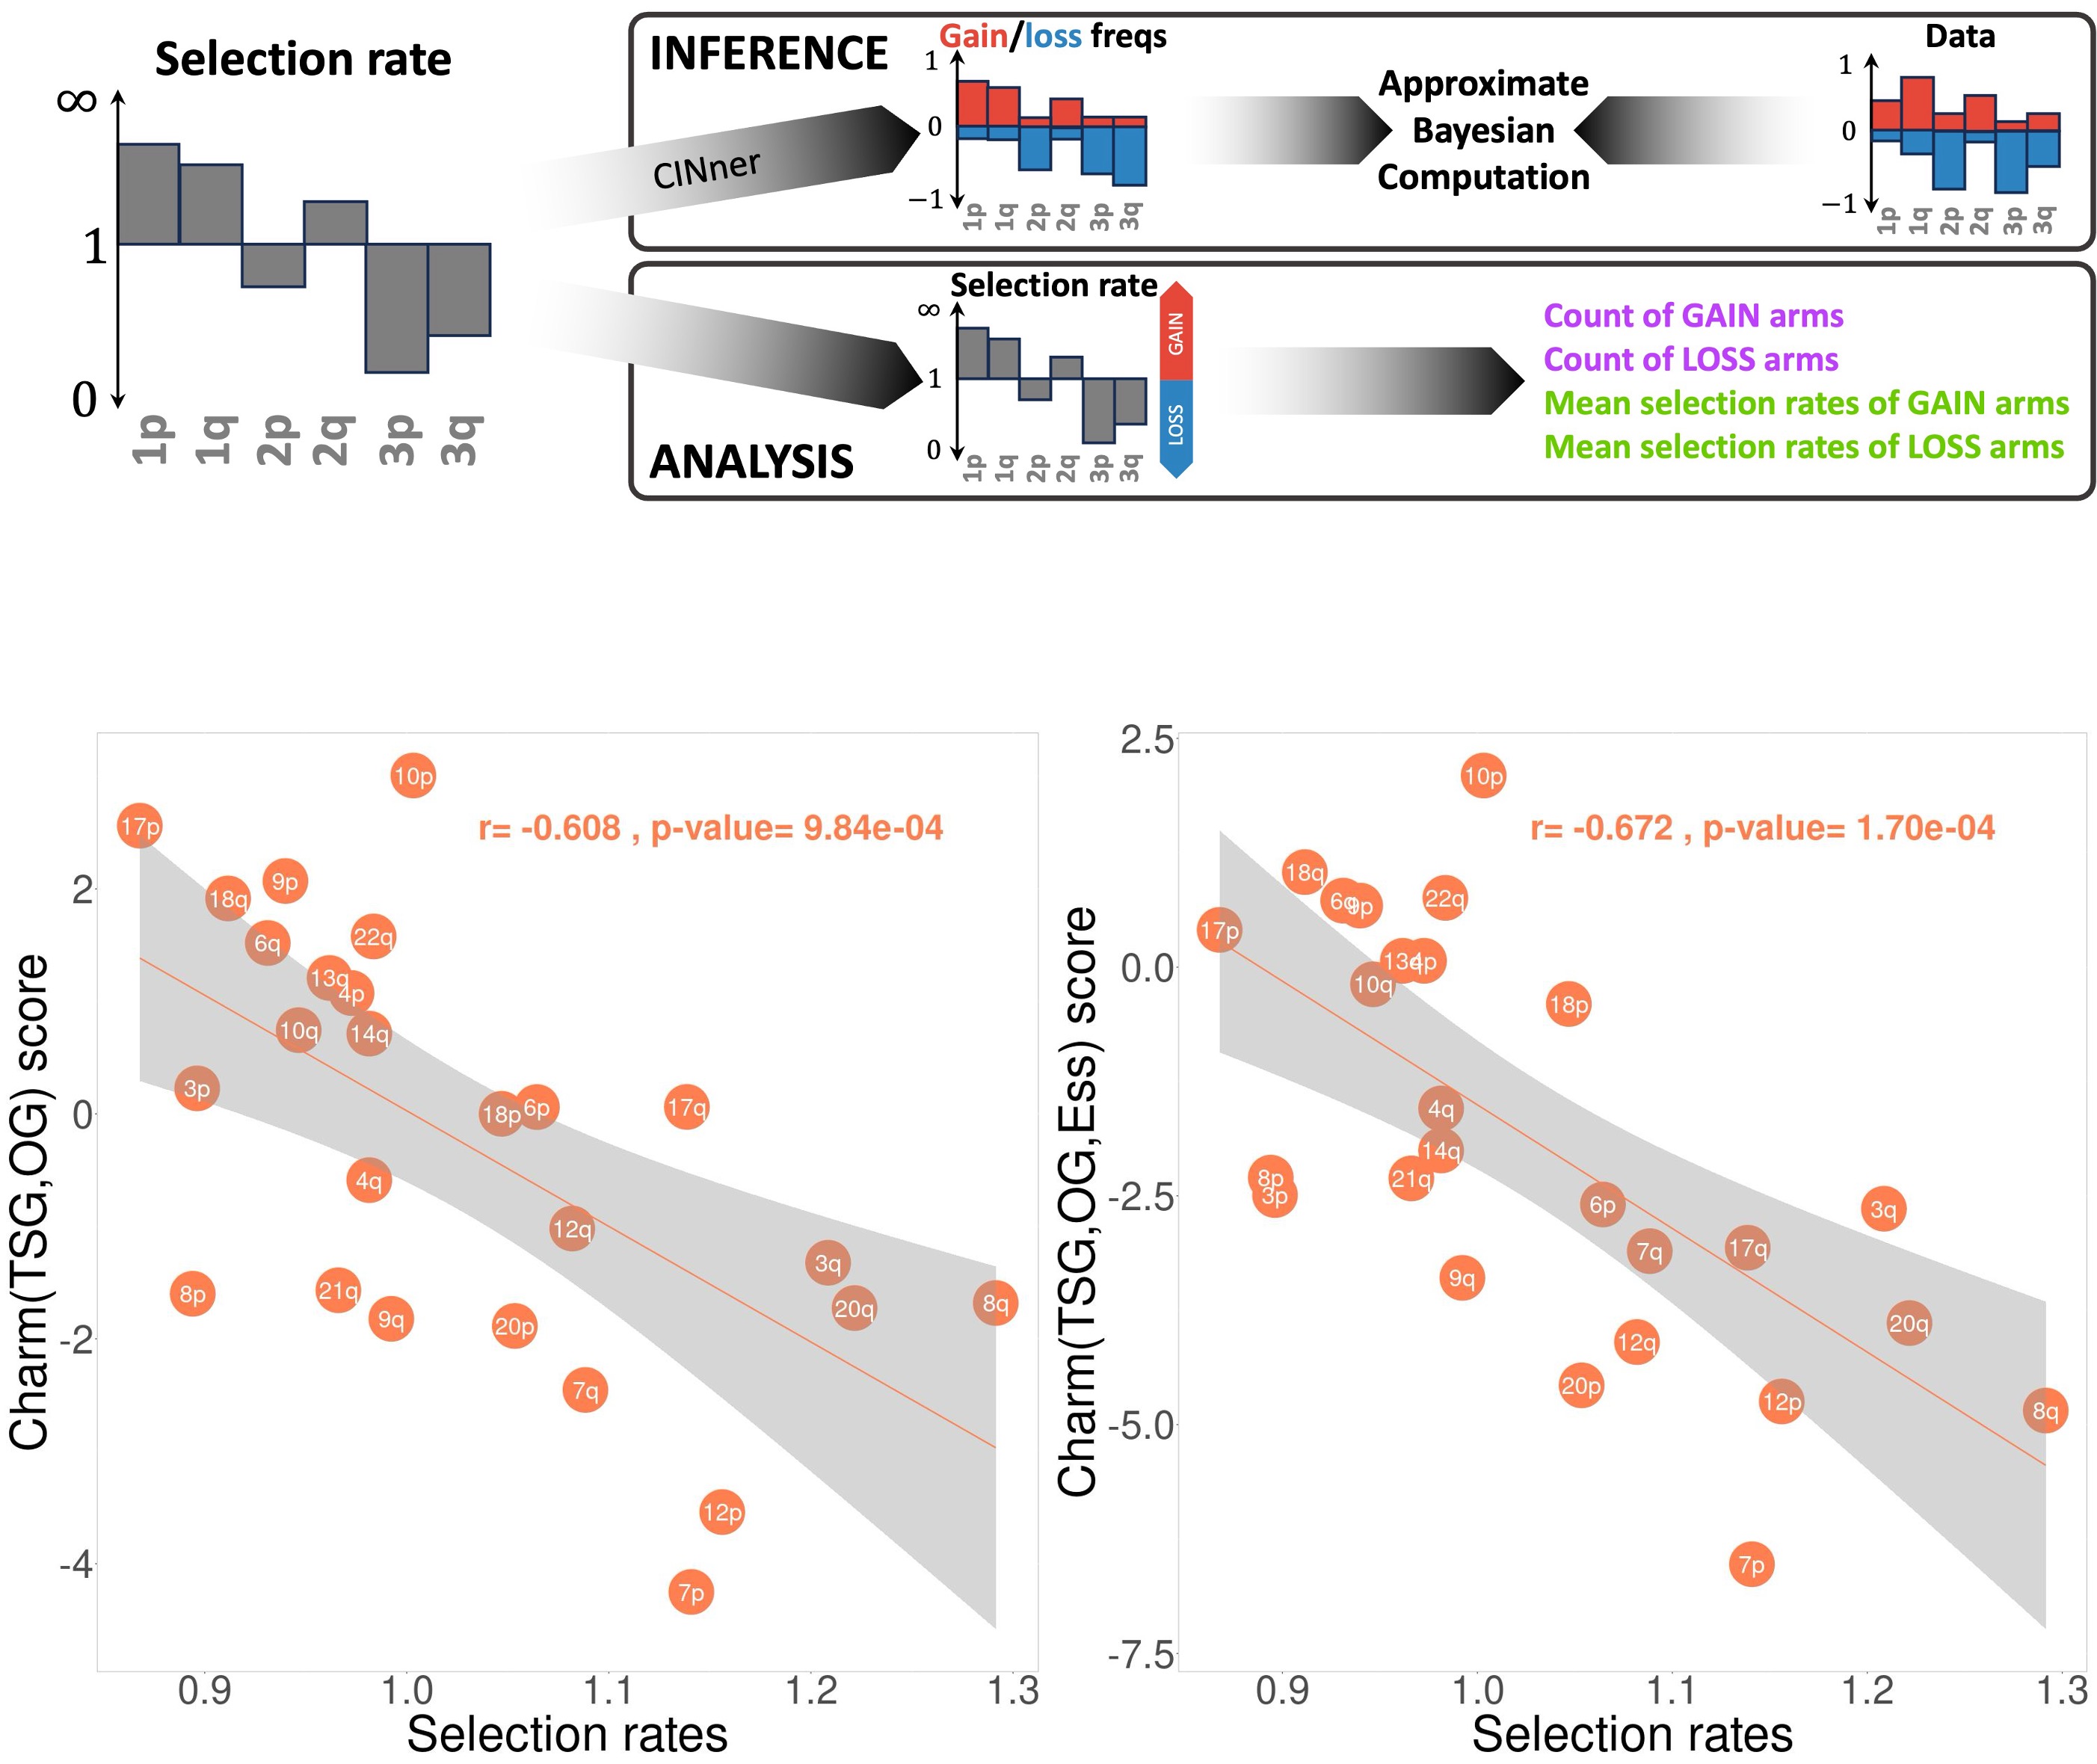
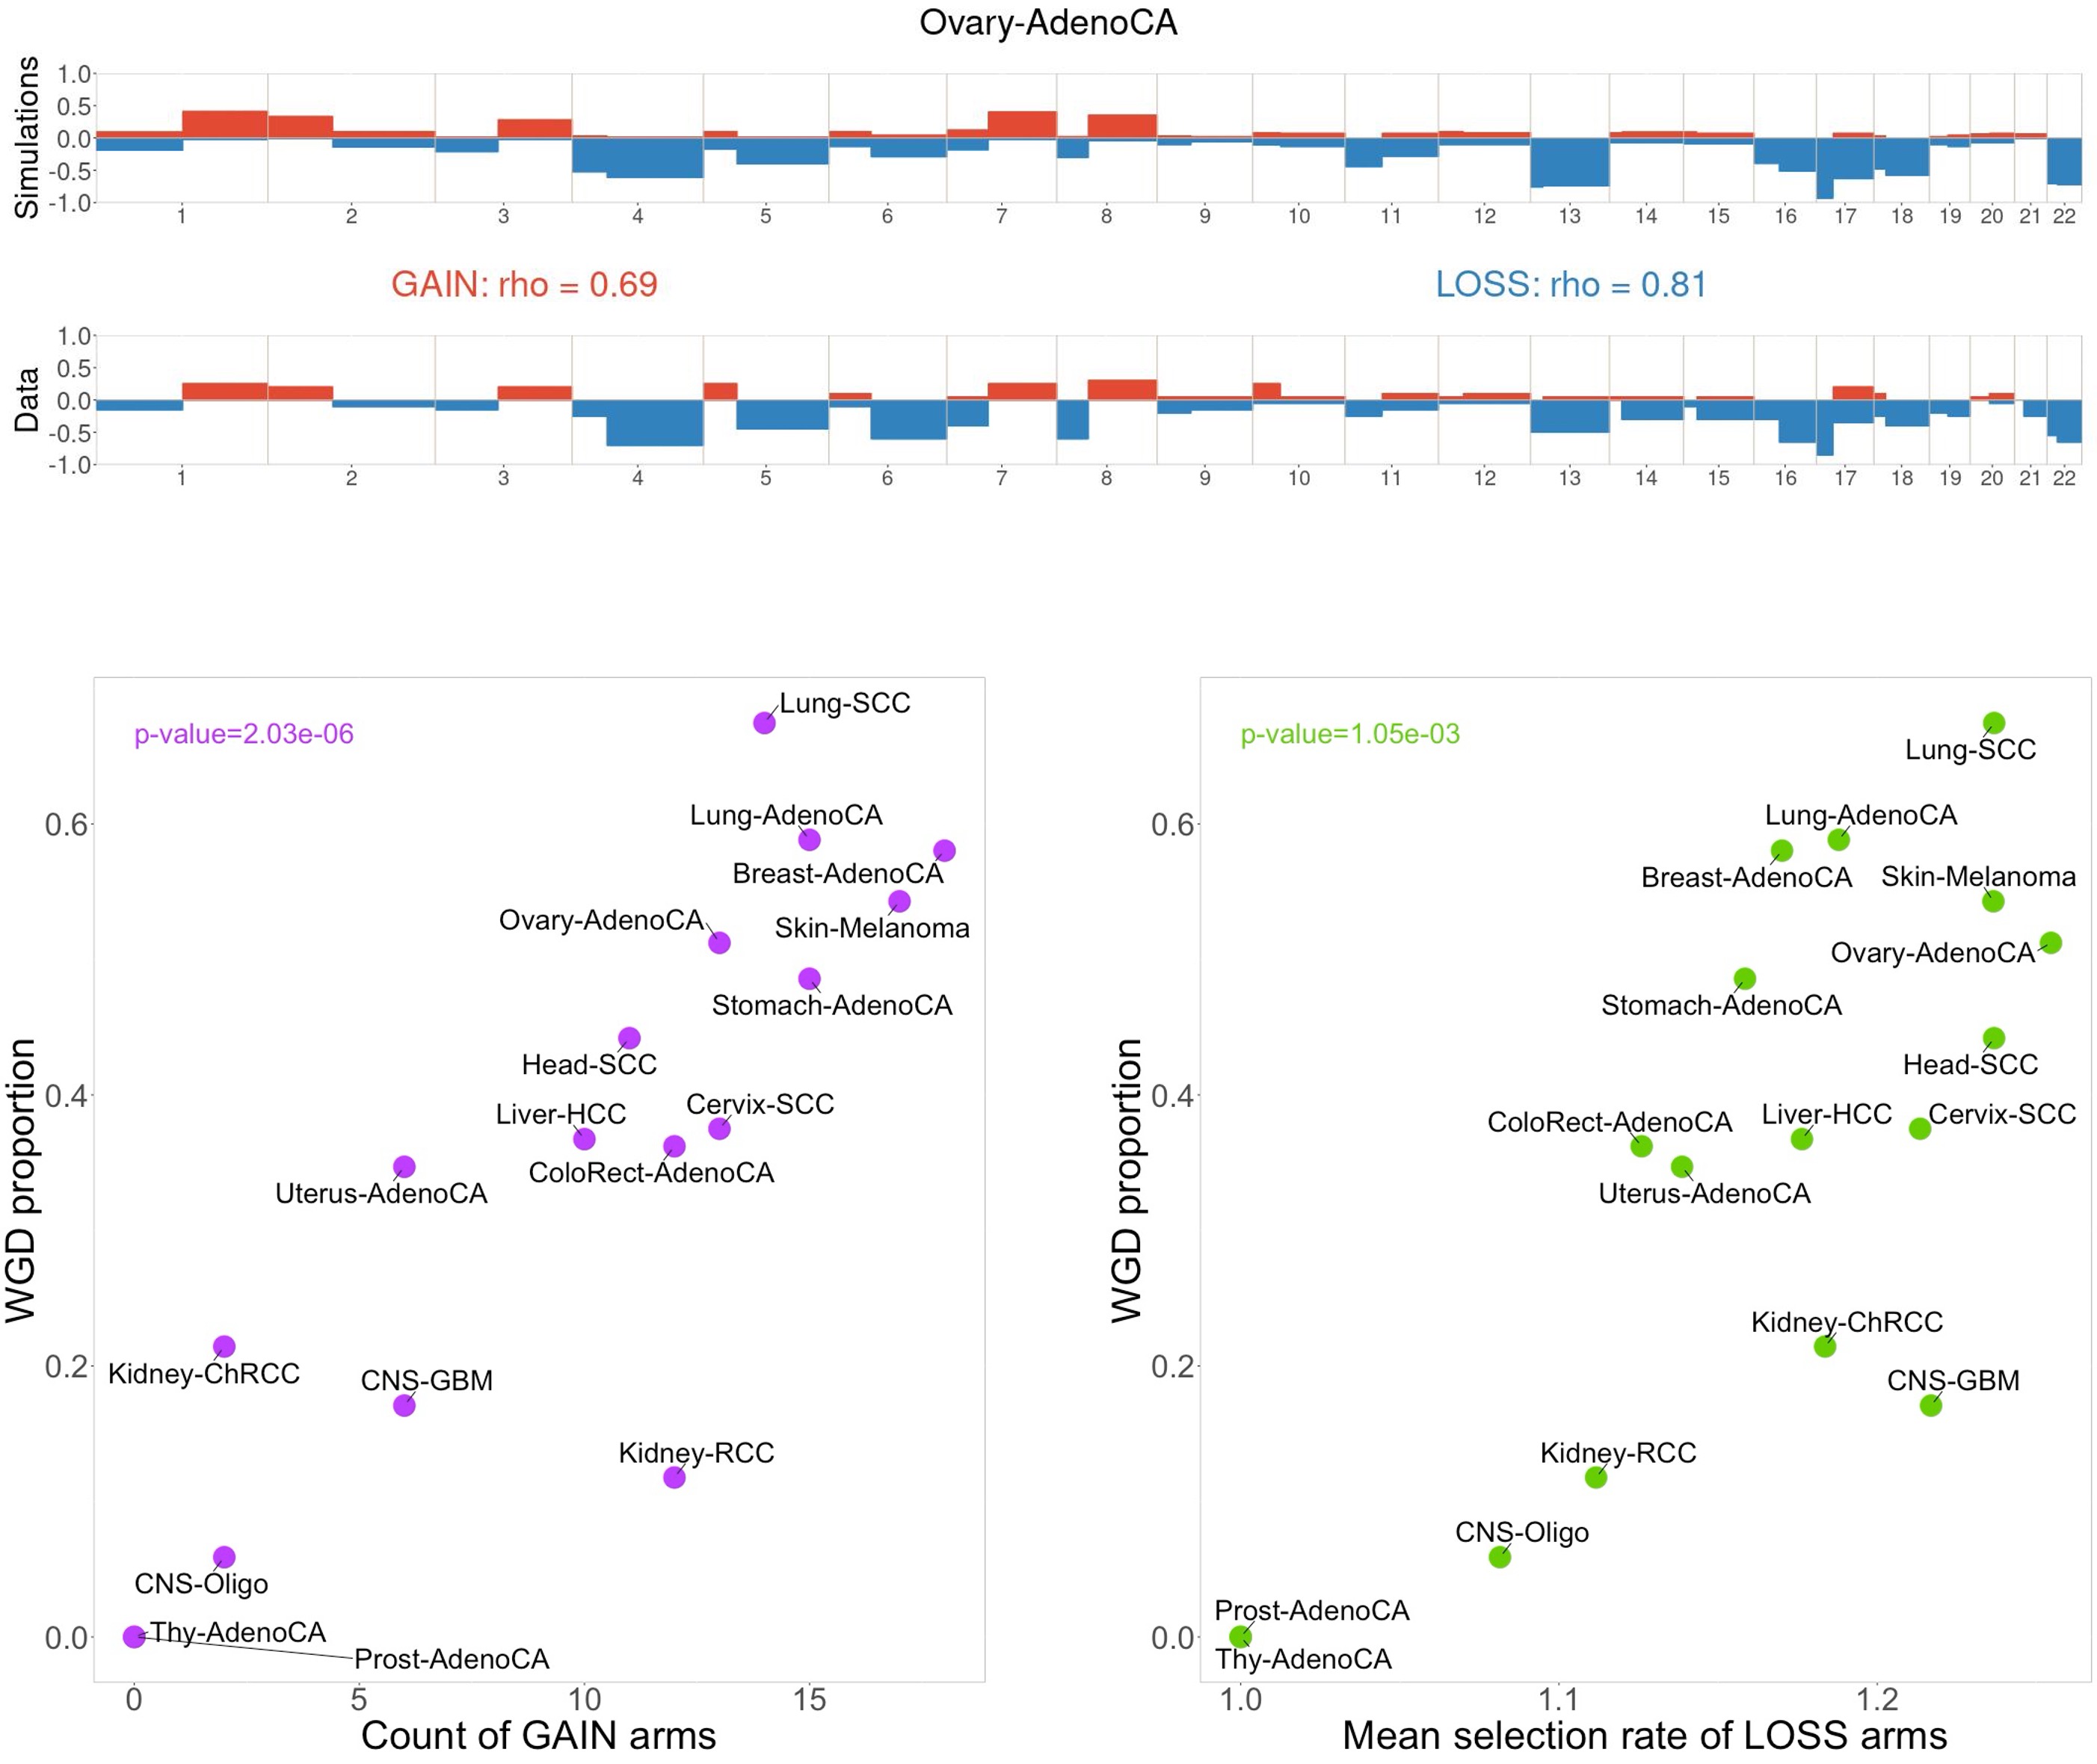
The same inference routine can be applied for individual cancer types, for which CINner finds selection parameters that faithfully recreate the copy number landscapes observed in data. These parameters are inferred using samples without whole-genome duplication (WGD), from which chromosome arms can be classified as GAIN (if the selection rate > 1, hence gains of these arms are advantageous) or LOSS (if the selection rate < 1, in which case losses increase cell fitness). The count and mean selection rate across these inferred GAIN and LOSS arms predict cancer-specific WGD prevalence well. On the one hand, this confirms that WGD is an important event that remolds the selection landscape during cancer development, as has been observed experimentally. On the other hand, this reconfirms CINner’s ability to uncover biologically relevant parameters from sample cohorts of relatively small sizes.
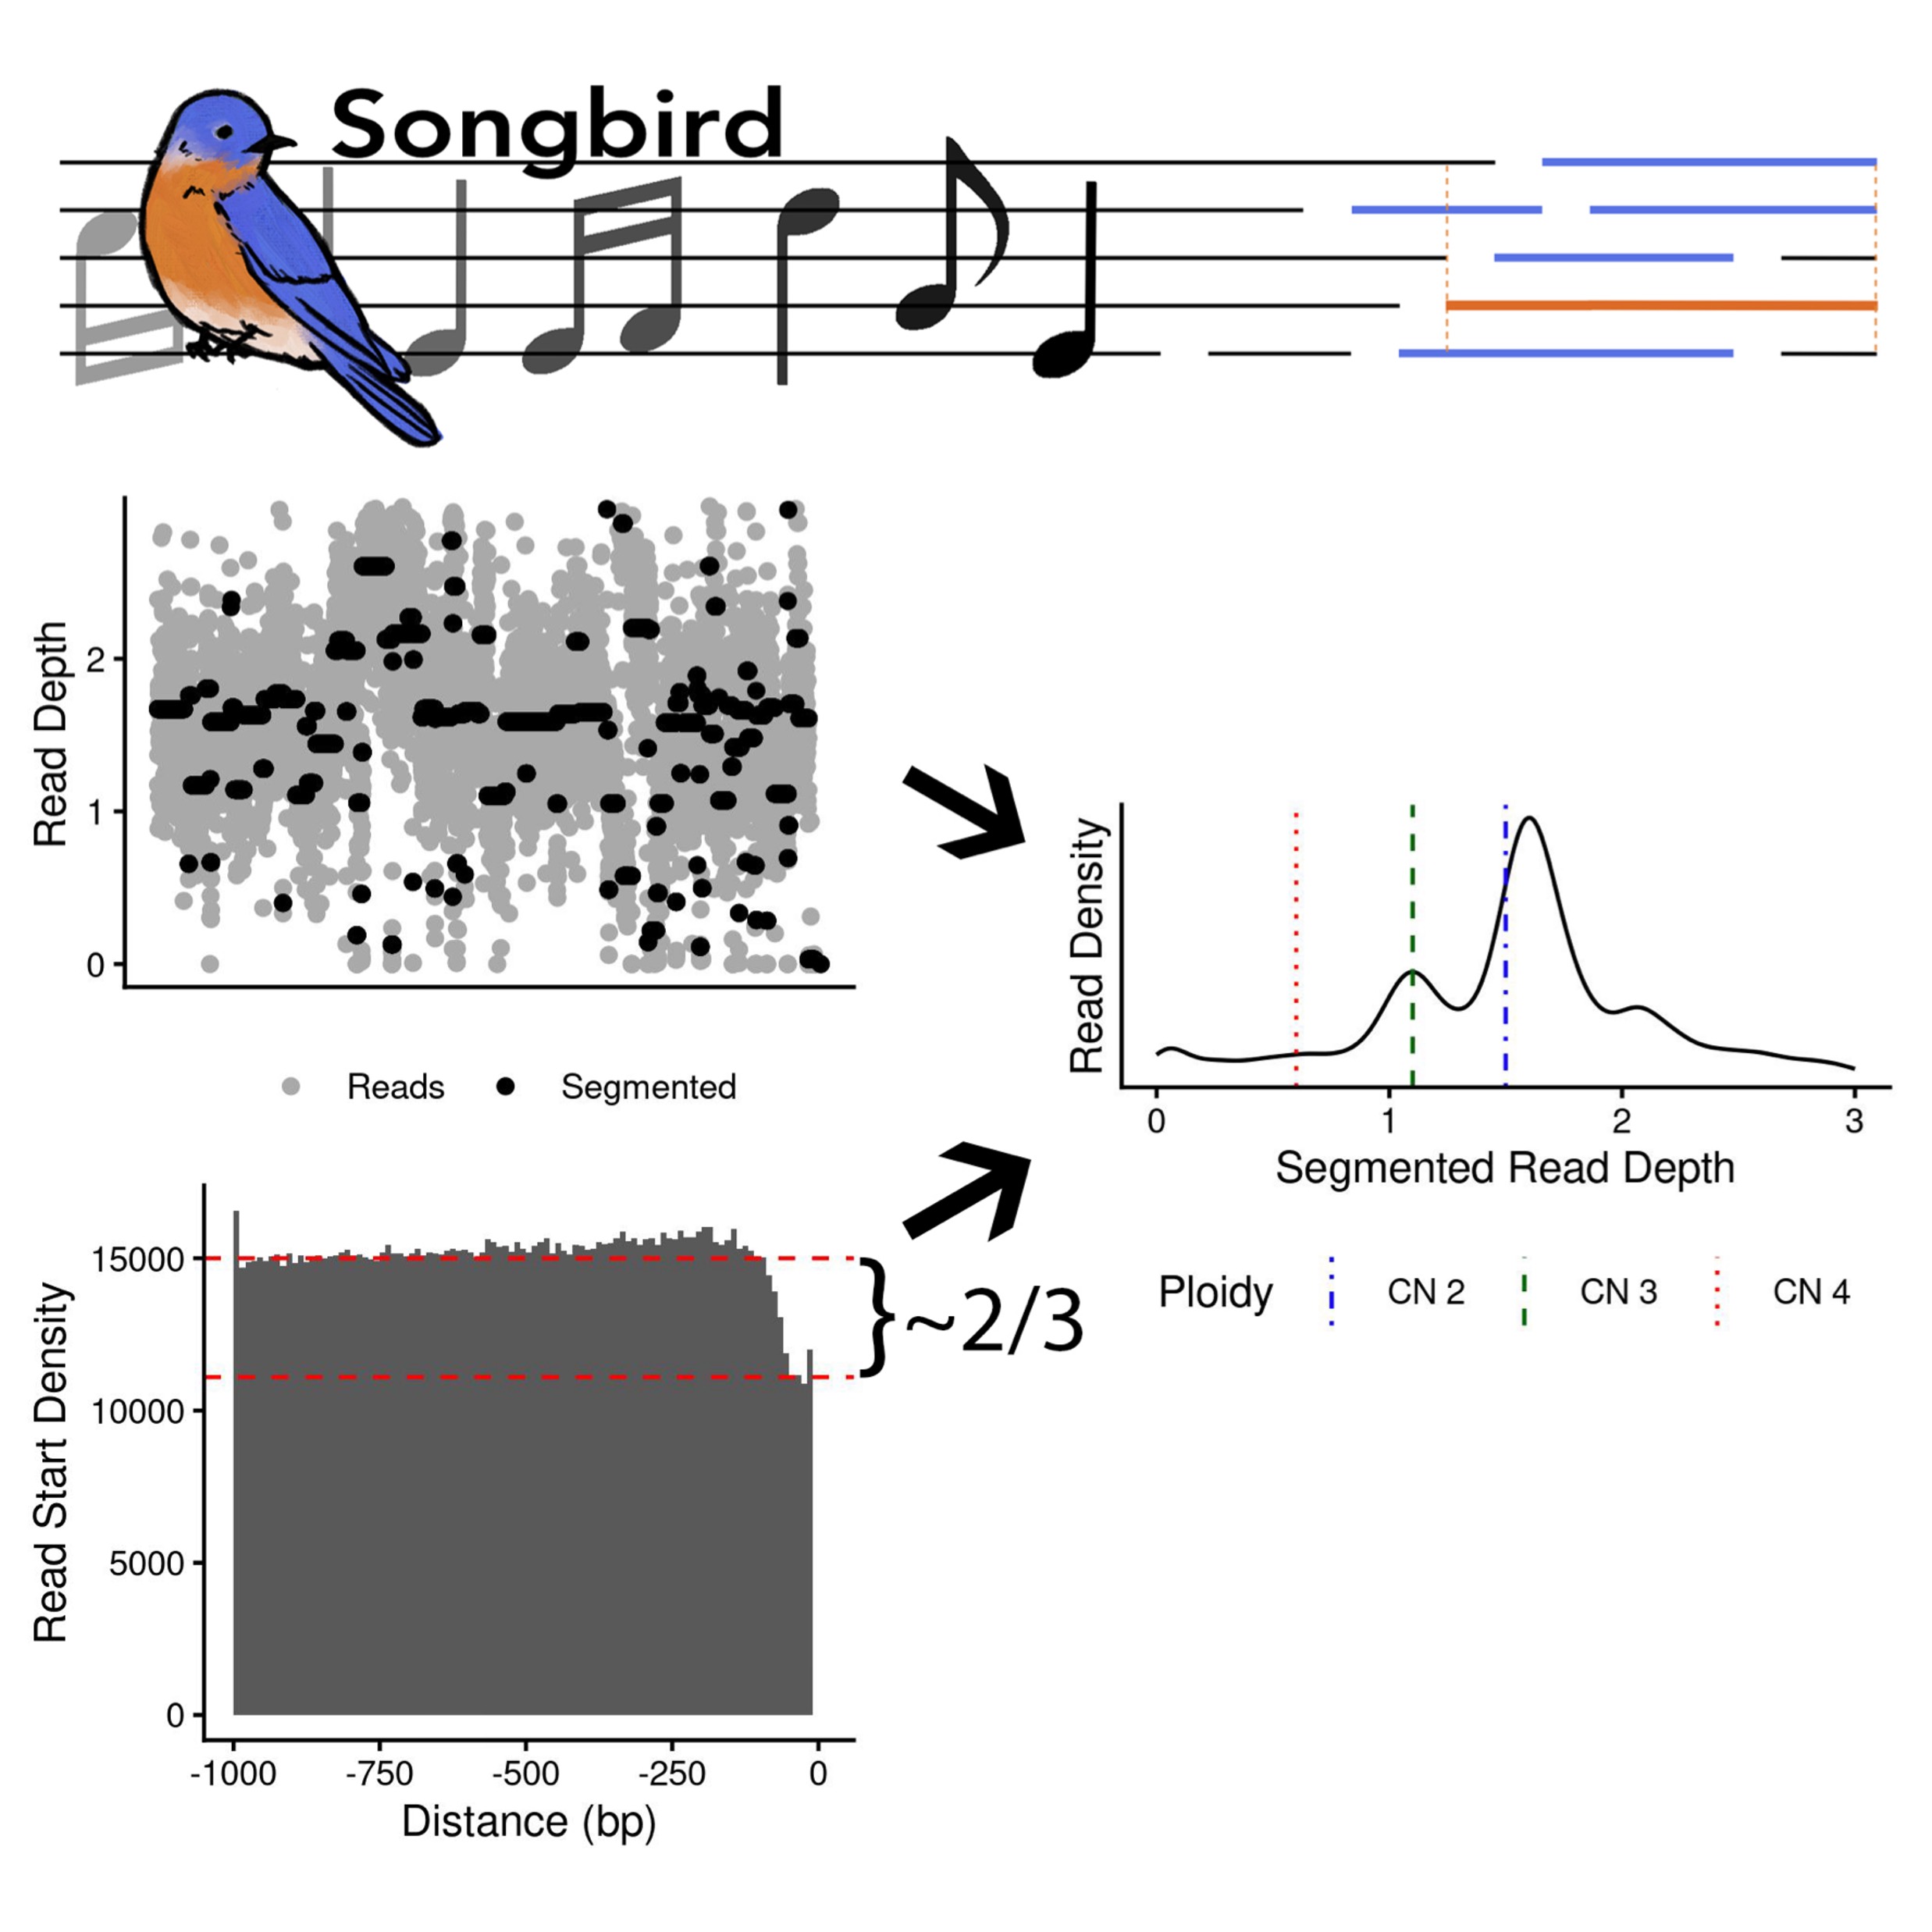
In addition to its applications in assessing chromosomal instability in DNA-sequencing data, CINner can also be used to benchmark analysis pipelines. It has been utilized in (McPherson et al., 2025) to assess the accuracy of inferred CIN and WGD from DLP data, and in (Wesley et al., 2025) as ground truth for CN calling algorithms.
With CINner, we now have a framework to uncover selection parameters for individual genomic regions. However, we are also interested in finding the rates at which CNA mechanisms occur, such as chromosome missegregations. This requires more information than what bulk genomic data can offer. This is because if a particular CNA is frequently observed in data, it can be explained by a spectrum of parameters in CINner. On one extreme, it could be because the CNA occurrence is high, therefore the event takes place often across different patients even if it does not significantly impact cancer fitness. On the other extreme, it could be because the selection rate associated with the CNA event is high, in which case it takes a long time to emerge but always expands across the entire tumor when it does. The parameters therefore are confounded in bulk data alone.
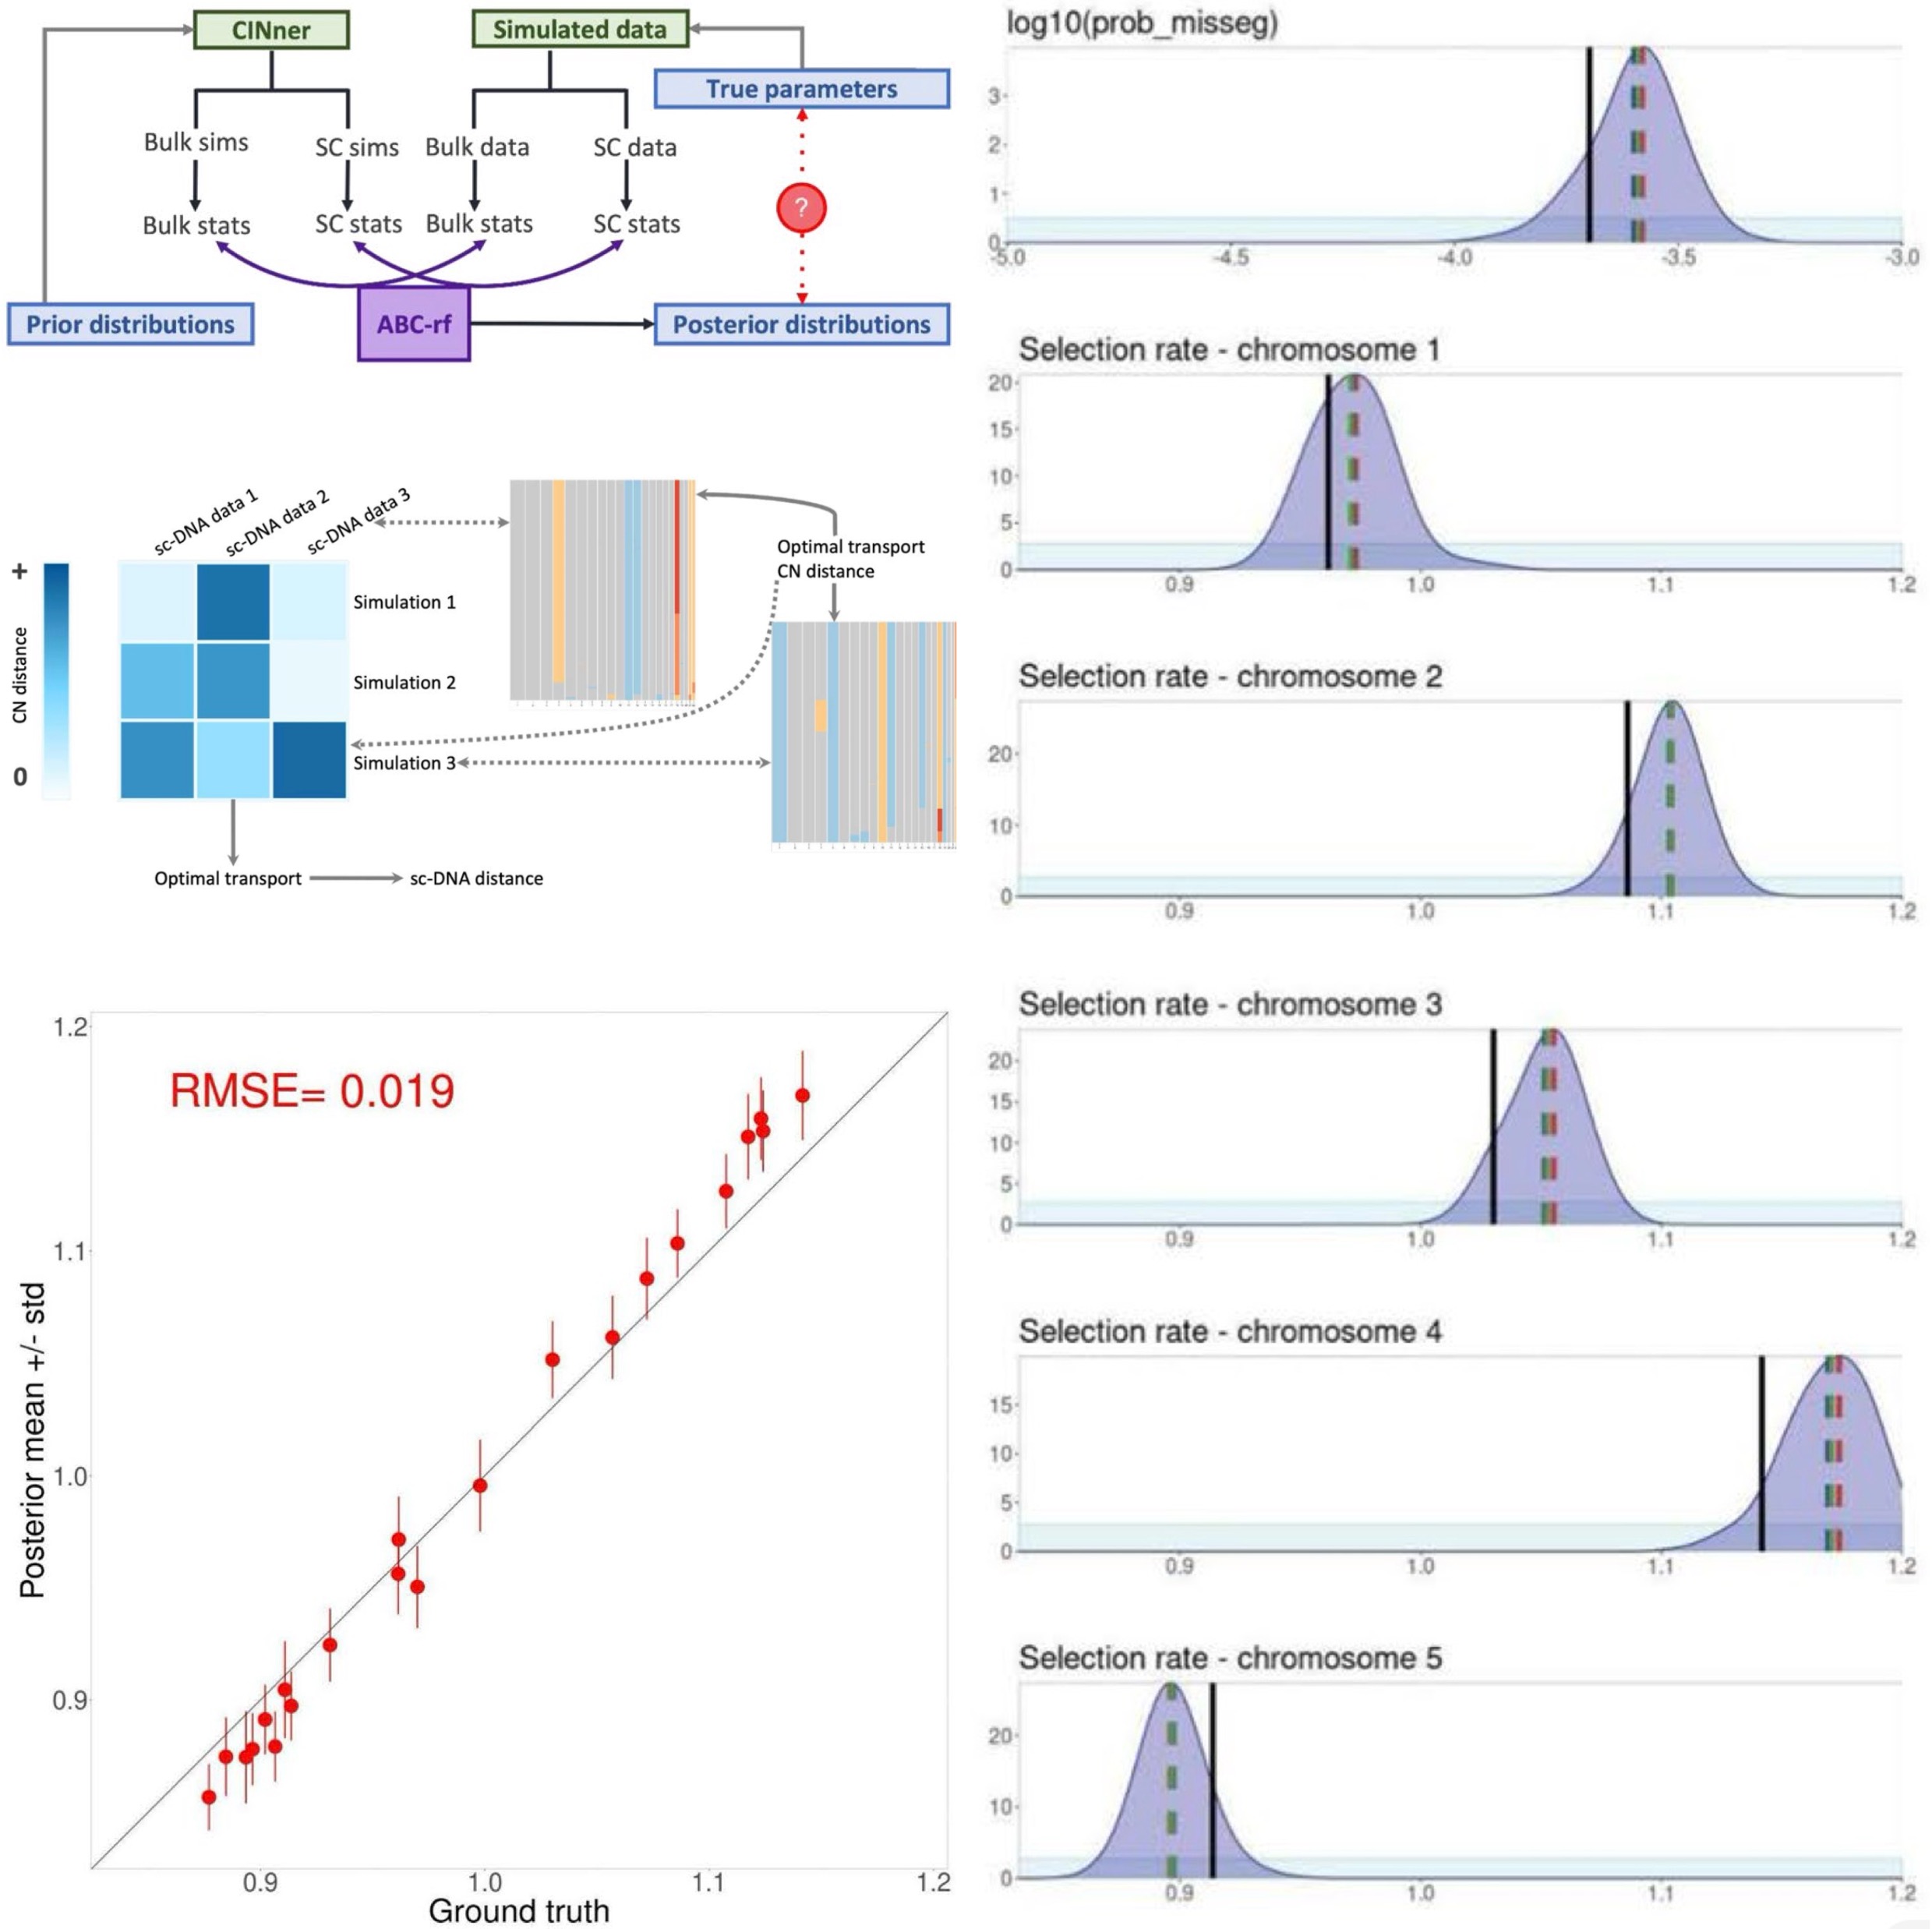
In (Xiang et al., 2024), we developed a parameter inference routine that employs both bulk data and information from single-cell (sc) sequencing, such as DLP+. The algorithm uses ABC-rf, an Approximate Bayesian Computation (ABC) method with random forests that produces reliable posterior distributions with high tolerance for noise. The ABC framework summarizes both data and model simulations with statistics, for which we considered a wide range of measurements based on bulk CN, single-cell CN profiles, and the phylogeny for cells in the single-cell samples.
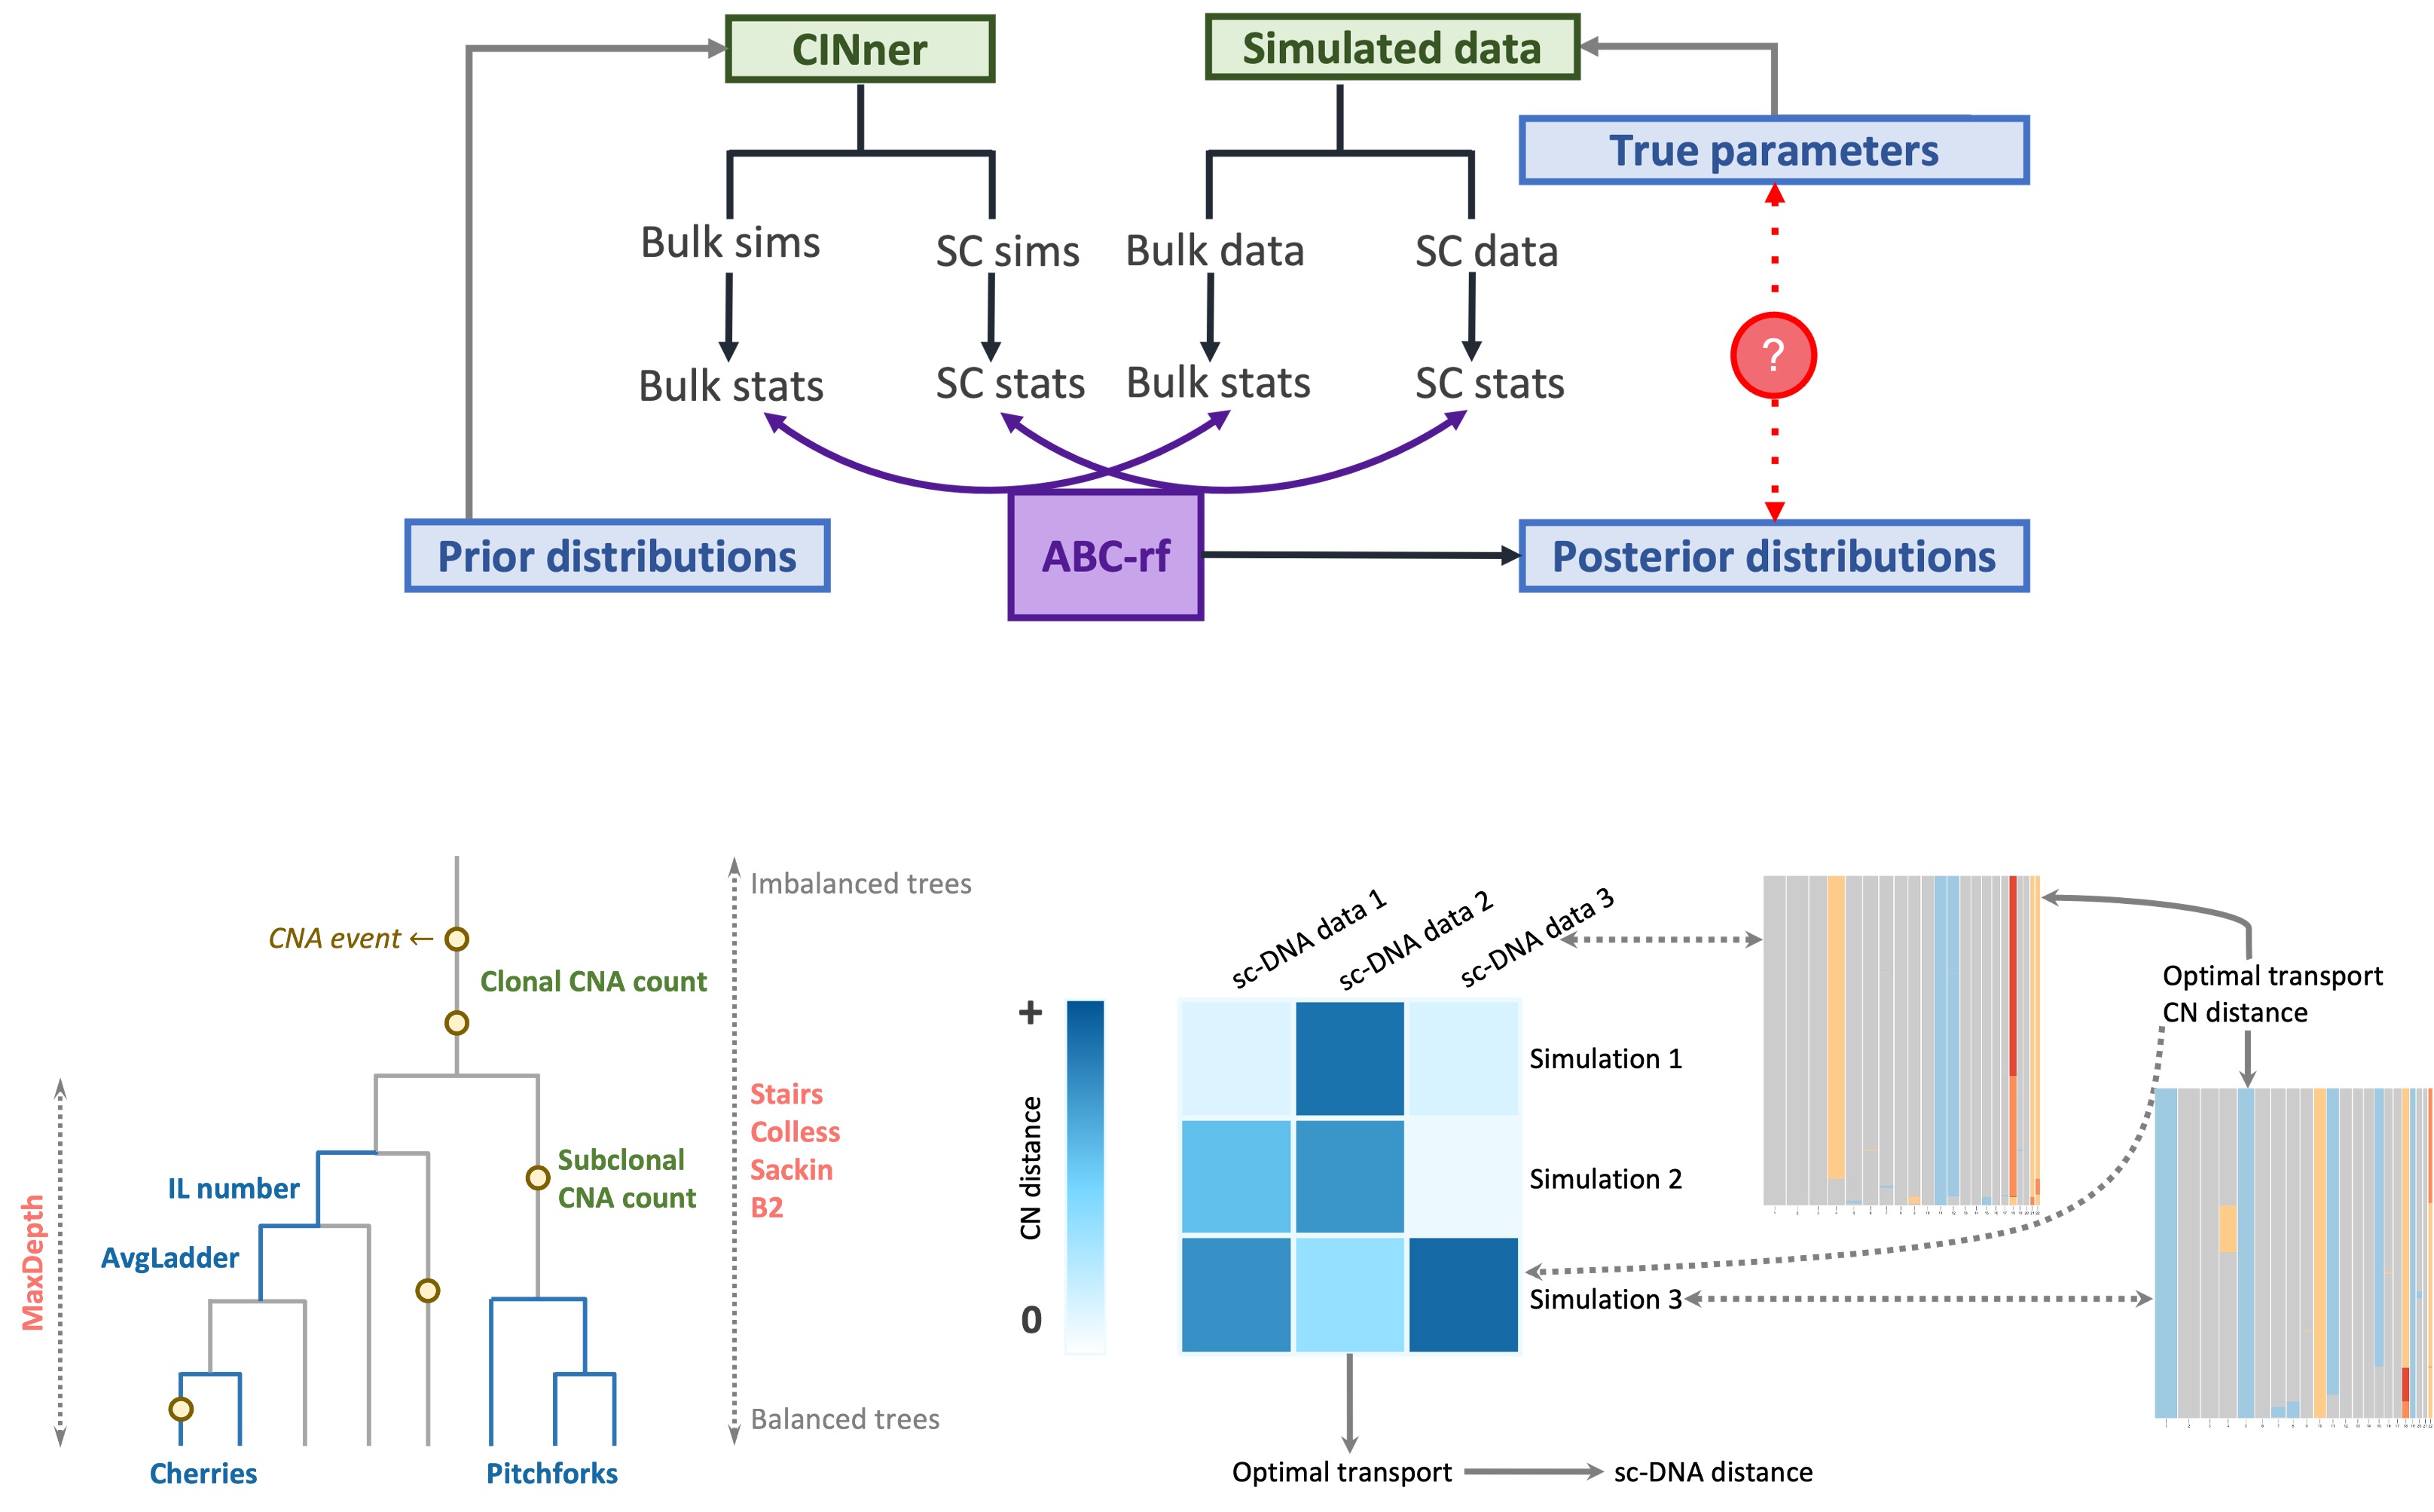
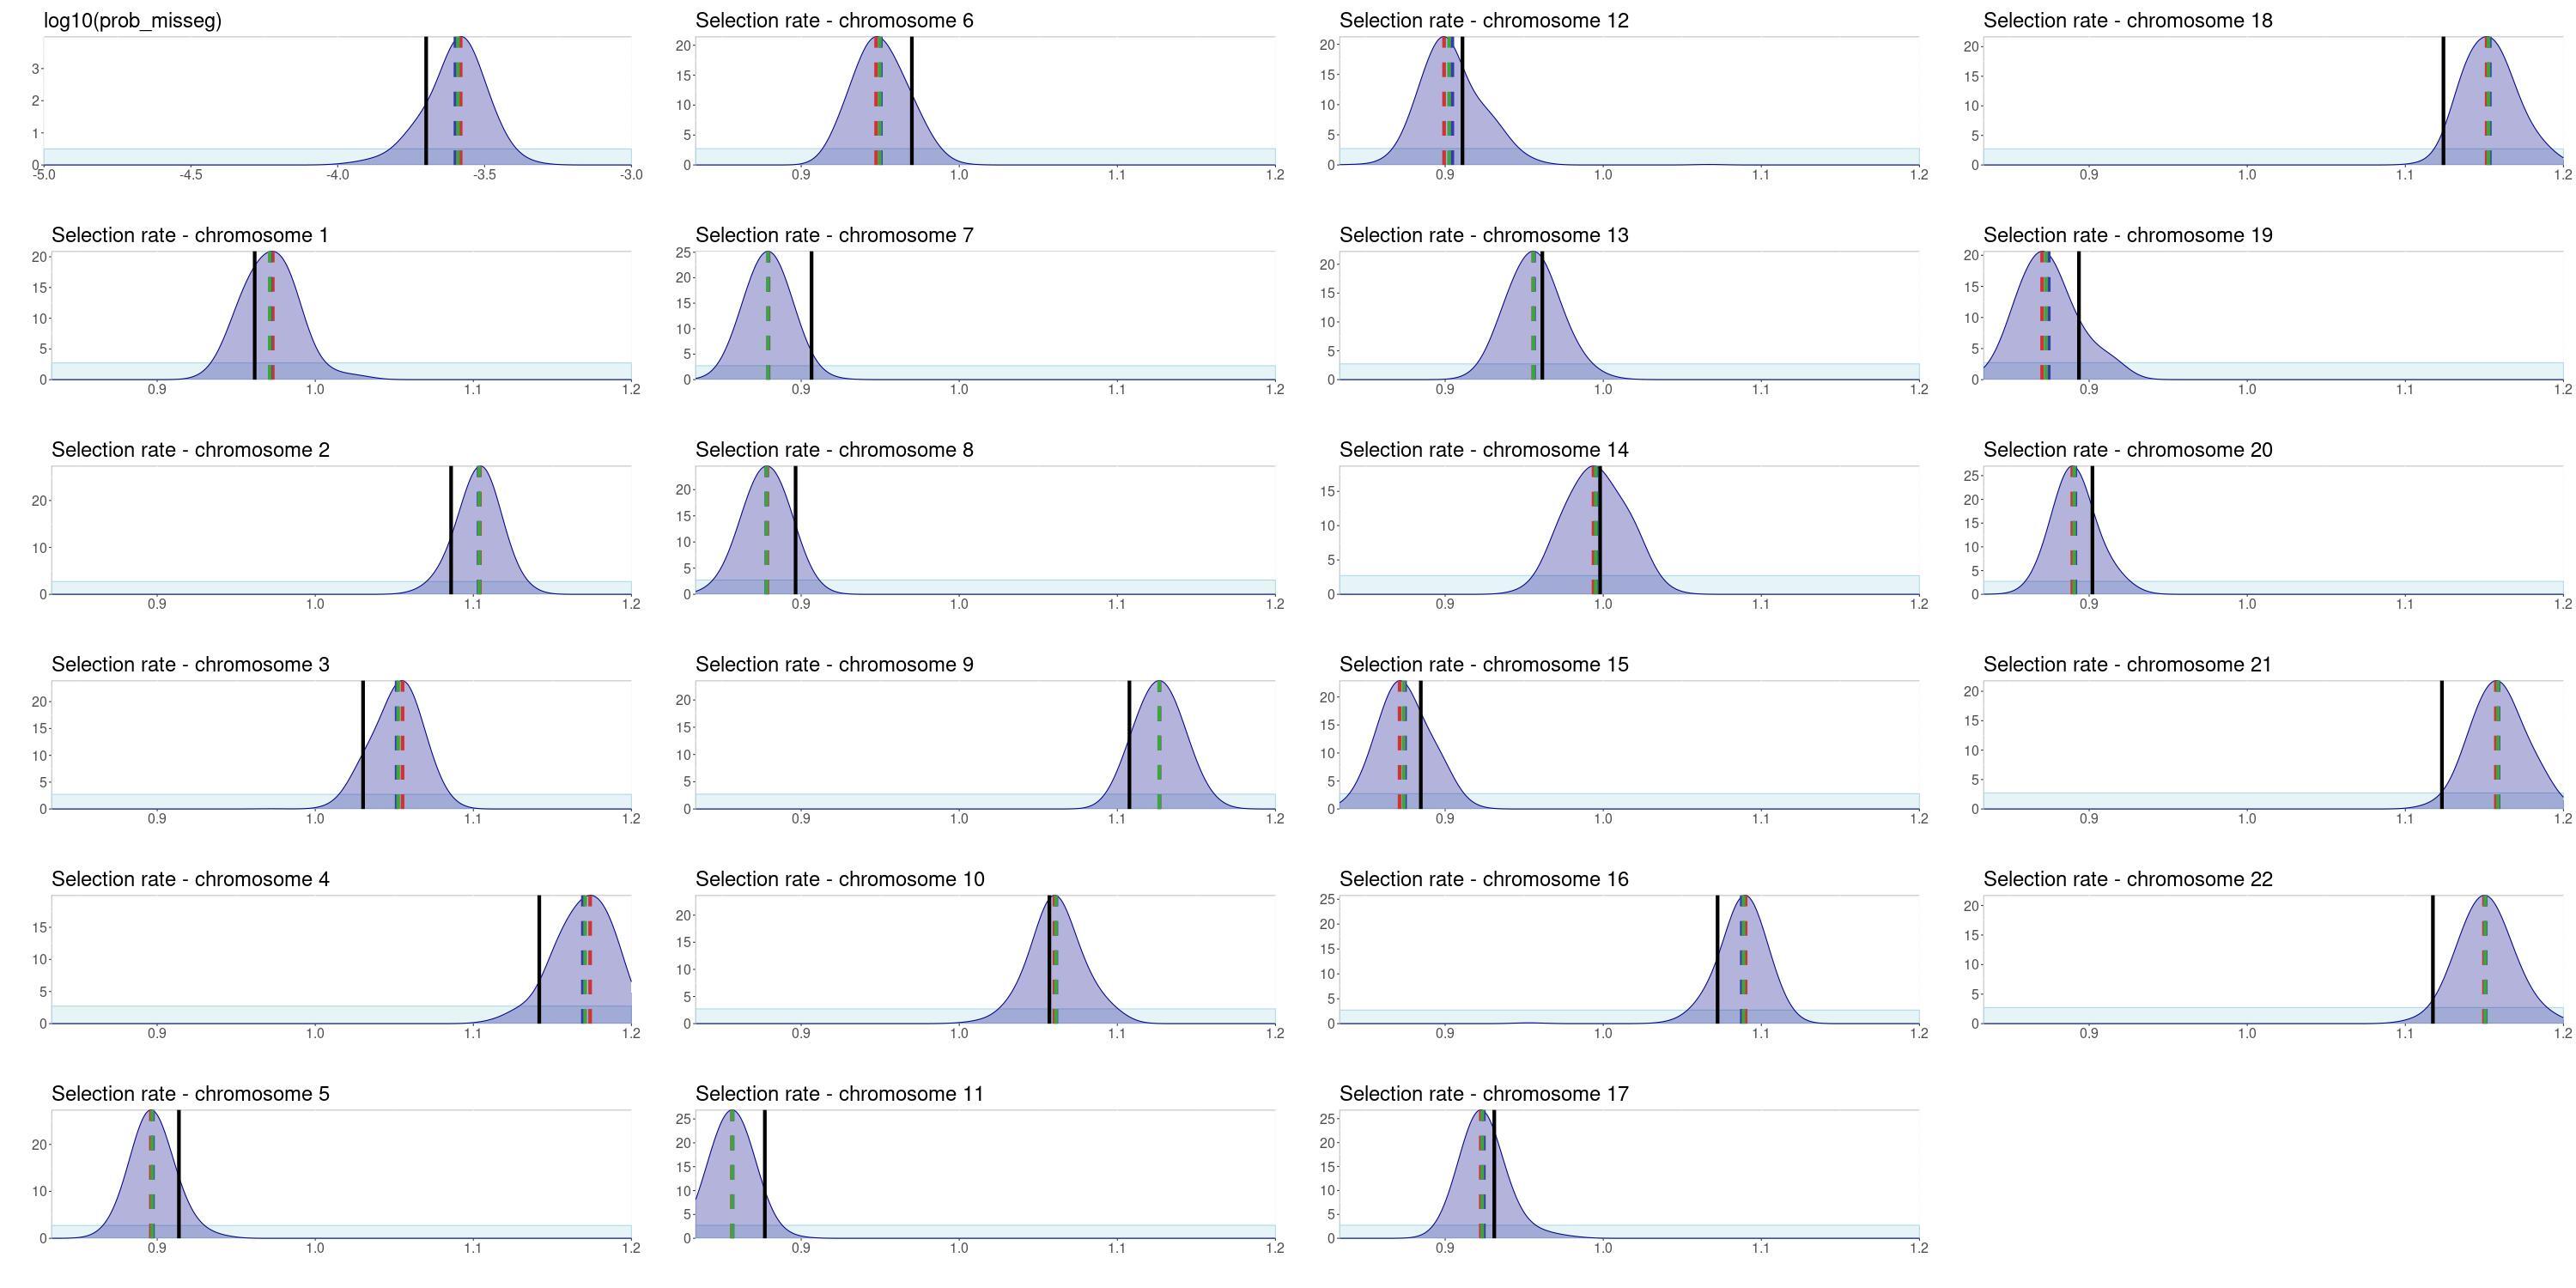
Using this framework, we are able to uncover the true values of both the missegregation probability and the selection parameters for individual chromosomes. This comparison was performed with synthetic tests, where we know the true values against which the parameter posterior distributions can be compared. The posterior distributions are unimodal, which indicates identifiability, and center around the ground truth values.
Importantly, the accuracy and uncertainty of the results (quantified as Root mean square error (RMSE) and standard deviation of the posteriors, respectively) do not increase significantly for small sample sizes of either single-cell or bulk cohorts. Minimum error can be achieved with as few as 40 sc and 50 bulk samples, while minimum uncertainty is reached with 20 and 30 bulk samples. These requirements are already satisfied with currently available data for some cancer types. We expect that as DNA sequencing becomes an essential part of cancer diagnosis, our simulation and inference framework will become a pivotal tool to analyze the data toward better understanding of cancer evolution and adaptation.

ABC-rf’s insensitivity to noise is essential for incorporating a large number of statistics in our inference method. It therefore offers an incredible advantage over traditional ABC methods, which require selecting substantially important hyperparameters and therefore are not flexible for such expansive problems and models such as ours. However, ABC-rf often requires a large training set and therefore long running time. To improve its performance, we developed Approximate Bayesian Computation sequential Monte Carlo with (distributional) random forests (ABC-SMC-RF) (Dinh et al., 2025).
A tree in the random forest grows from a root node, composed of a subsample or bootstrap sample of the training set. The algorithm then repeatedly divides each node, each time by choosing a particular statistic and segregating the node’s simulations into those whose values are lower or higher than a threshold. The choice of statistic and threshold at each node is made such that the simulations in each child node are most “similar” to each other, with respect to the given statistic. Finally, the algorithm traverses each tree with the statistics measured from the data. Simulations in the same leaf that the data ends up in are deemed closer to the data, hence the parameters of those simulations form an approximation for the posterior distribution.
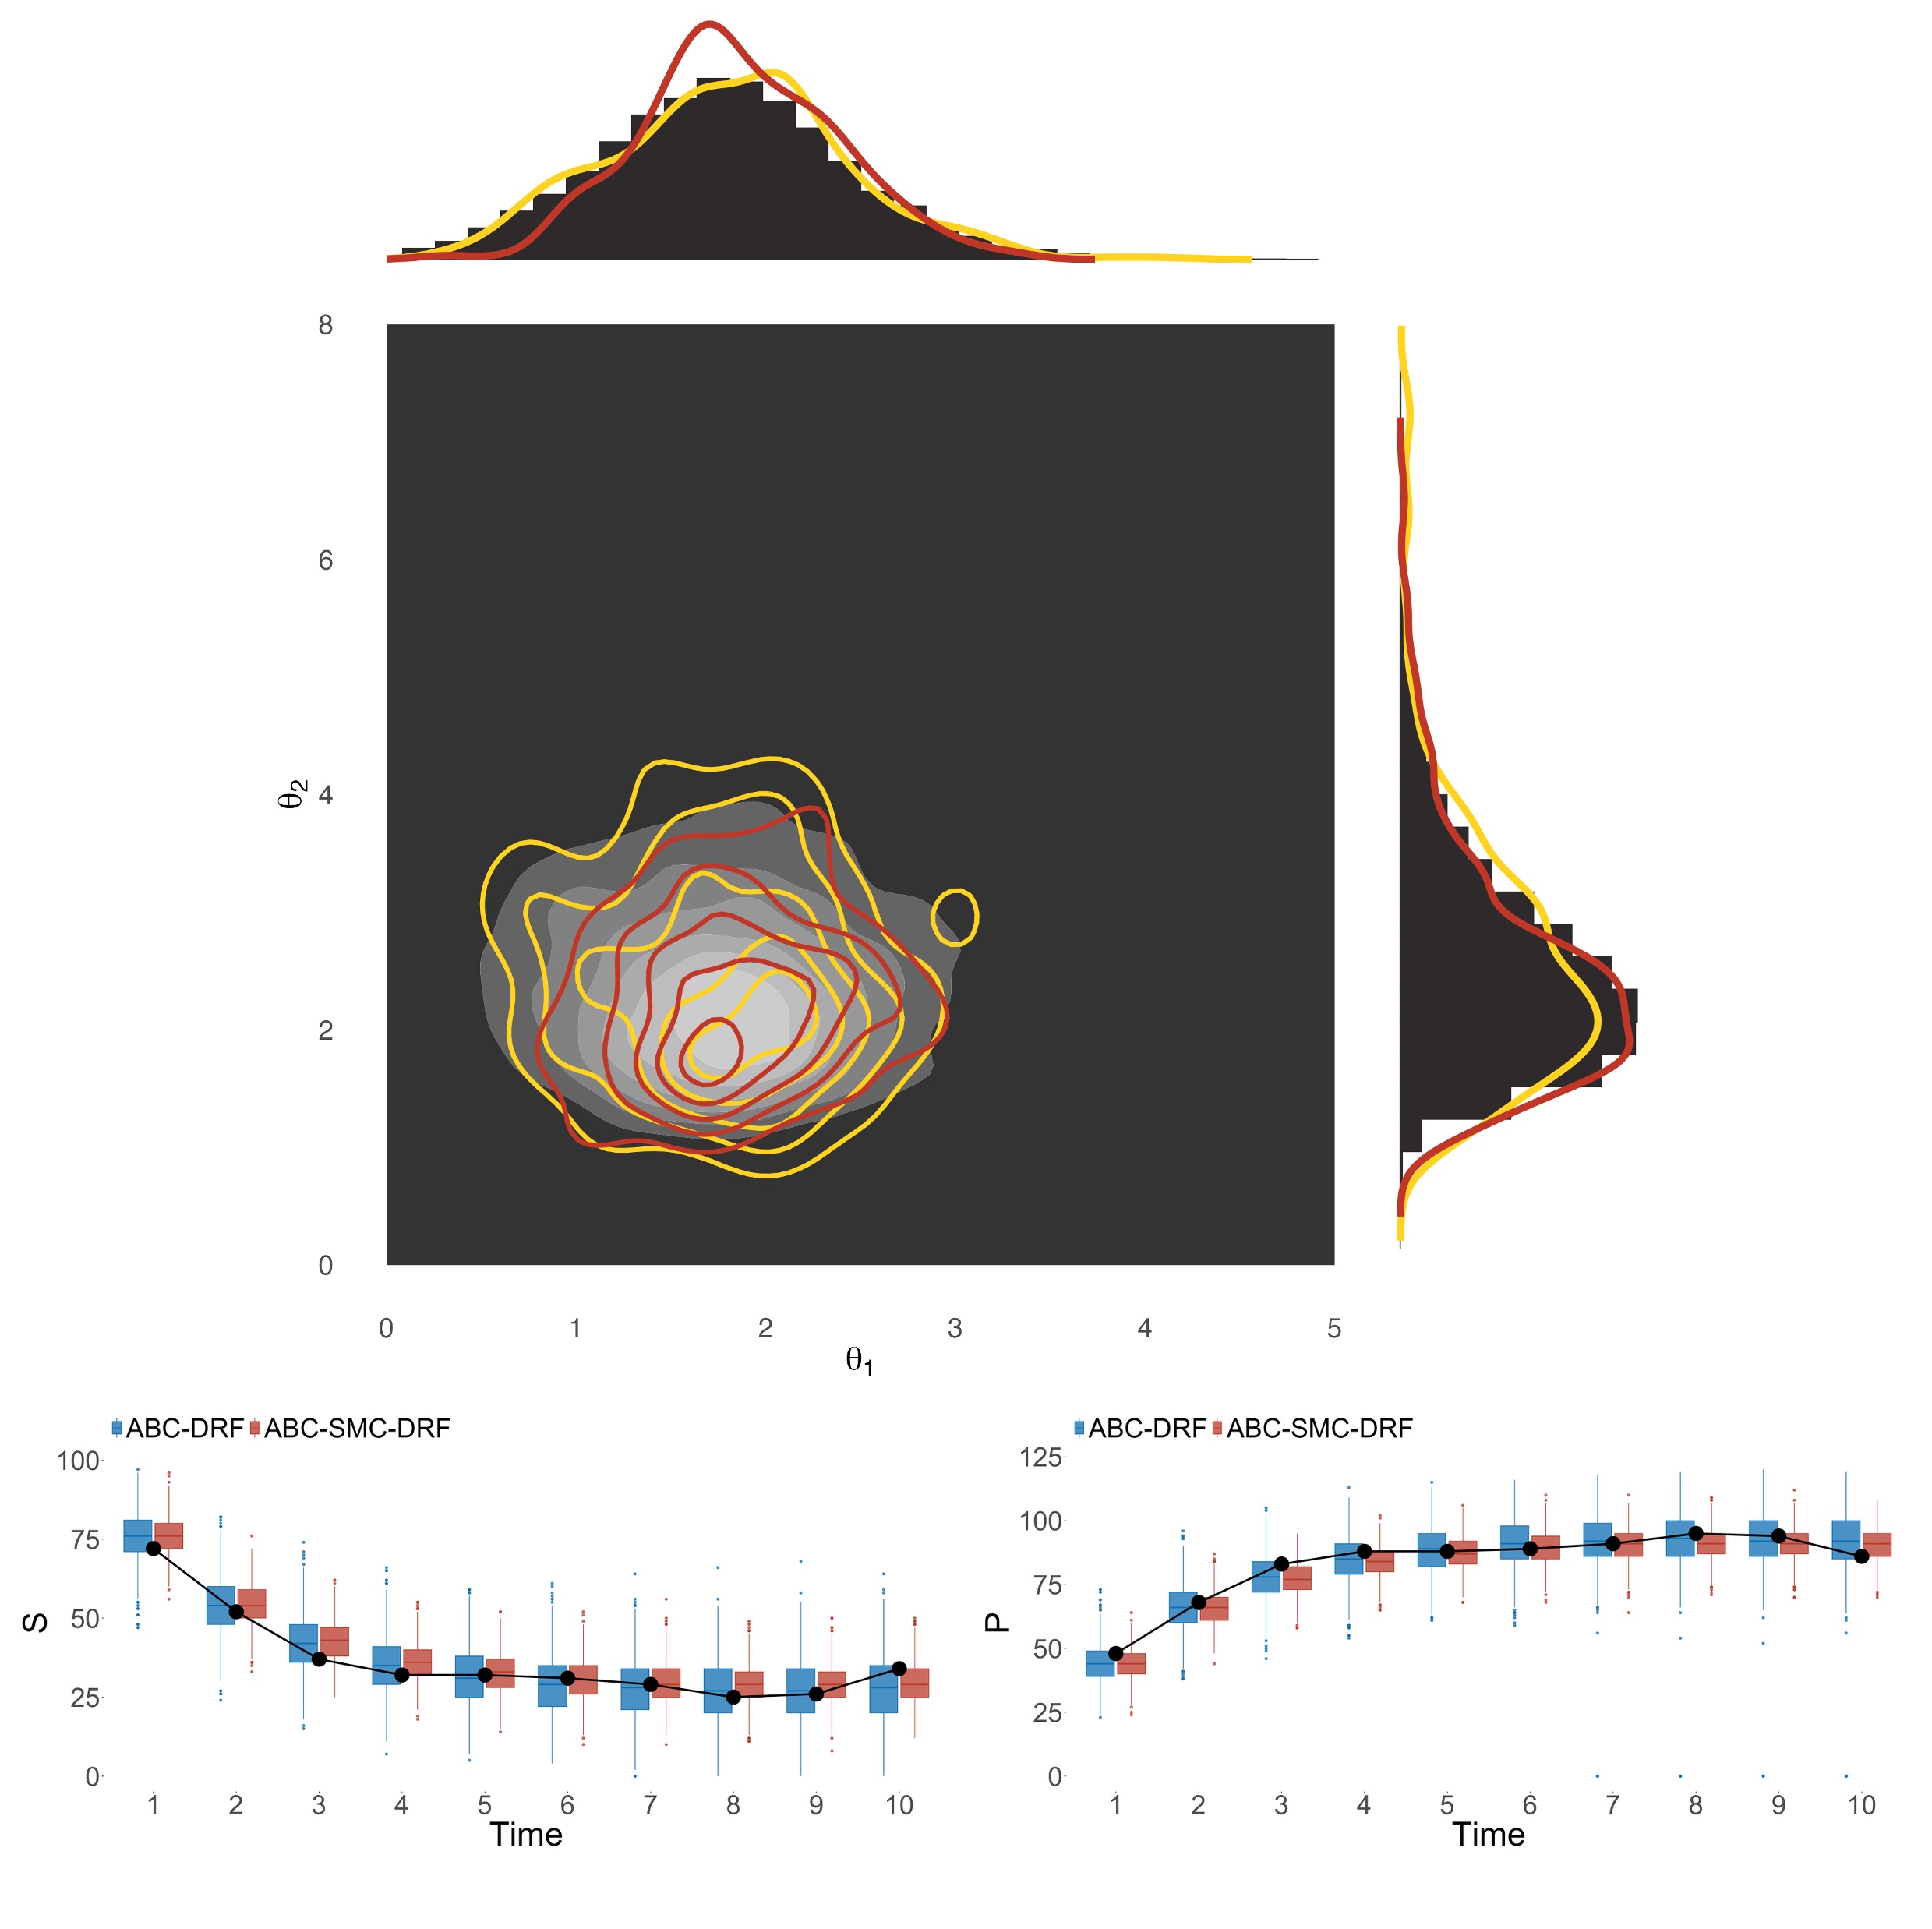
ABC-SMC-RF incorporates the random forest within the framework of sequential Monte Carlo (SMC), and it is available as an R package on Github. In SMC, the posterior distribution is improved through successive iterations from the prior distribution. Each iteration in ABC-SMC-RF samples the parameters from the previous iteration’s posterior, perturbs the parameters to maintain parameter diversity, then infers the next posterior distribution with random forest.

In test studies, ABC-SMC-RF performs well across a wide range of mathematical models, including both deterministic and stochastic models with varying complexity levels and parameter counts. Its results are on par with traditional ABC methods with carefully calibrated hyperparameters. Moreover, ABC-SMC-RF tends to perfom better than previous random forest methods, which are also calibration-free. This is because in those algorithms, most simulations with parameters sampled directly from the prior distribution are significantly different from the data. They therefore require a large training set to select the most relevant parameter regions. By comparison, ABC-SMC-RF iteratively updates the parameter distributions, therefore more of the simulations are relevant to the data. Another practical advantage is that the random forest in each iteration can be trained on smaller training sets, therefore reducing computational runtime and storage requirement.

